
2016 State of the U.S. Labor Force
By: Chuck Vollmer
11 January 2016
Download a copy of this report at:
2016 U.S. Labor Force State-of-the-Union 11 Jan 2015
Executive Summary. To get a true picture of the 2016 state of the U.S. labor force, one must examine all three labor force categories reported by the U.S. Bureau of Labor Statistics (Employed, Unemployed and Not-in-Labor-Force) as opposed to focusing on the “official” Unemployed rate known as the U3 rate, which represents only 2% of the U.S. population or 5% of the U.S. civilian labor force. While Americans should be pleased that the U3 rate has dropped from its post Great Recession 10% peak to 5% today, America should concentrate on the combined non-working Not-in-Labor-Force and total unemployed (U6) population that encompasses 34% of the U.S. population.
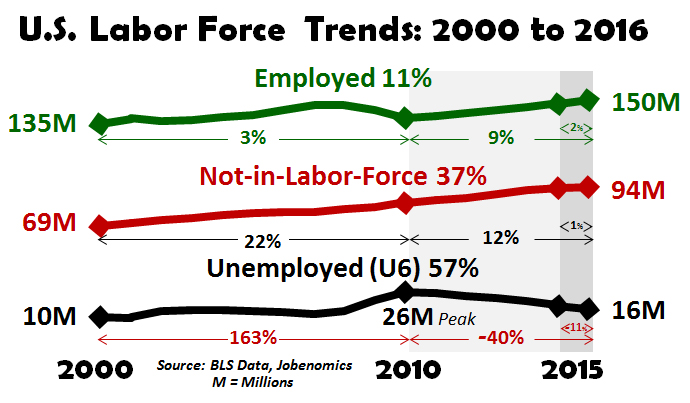
From January 2000 to January 2016, the number of citizens Employed rose by 11%, Not-in-Labor Force by 37% and U6 Unemployed by 57%. Since the end of the Great Recession in 2010 through 2015, Unemployment dropped by 40% but voluntary workforce departures continued a steady exodus reaching a high watermark of 94 million able-bodied adults who choose not to work. If this trend remains unabated, Jobenomics forecasts that America’s able-bodied, not-working population could equal its working population by the mid-2020s, or sooner if the United States slips into recession.
By not including the able-bodied, not-working population in State of the Union deliberations, policy-makers play a statistical shell game with American citizens who cannot be expected to comprehend the intricacies of labor force statistics. Sooner or later, the American people will figure out that it is theoretically possible for the United States to have a zero rate of unemployment while simultaneously having zero people employed in the labor force. The reason for this disquieting statement involves how government measures unemployment. To be classified as unemployed, one must be looking for work. Able-bodied Americans who quit looking and voluntarily depart the workforce are accounted in the Not-in-Labor-Force category—a category that is generally never mentioned in politics or the media.
While Americans should be pleased that employment is gradually increasing and the unemployment rolls are dropped significantly from Great Recession highs, they should be alarmed by exodus of tens of millions of able-bodied American adults to the netherworld of public/familial dependency and alternative lifestyles that harm economic growth and place greater burden on working and taxpaying Americans.
Jobenomics 2016 State of the Union’s Labor Force Assessment.[1] As of 1 January 2016, out of a total U.S. population of 322,810,000[2], there are 70,874,000 citizens that cannot work (22% of the population consisting mainly of children, caretakers, retired, disabled, institutionalized and active duty members of the armed forces) and 251,936,000 citizens in the Civilian Noninstitutional Population (78% of the population consisting of all persons in the Civilian Labor Force and Not-in-Labor-Force categories that are 16 years of age and older and not inmates of mental or penal institutions or military active duty).
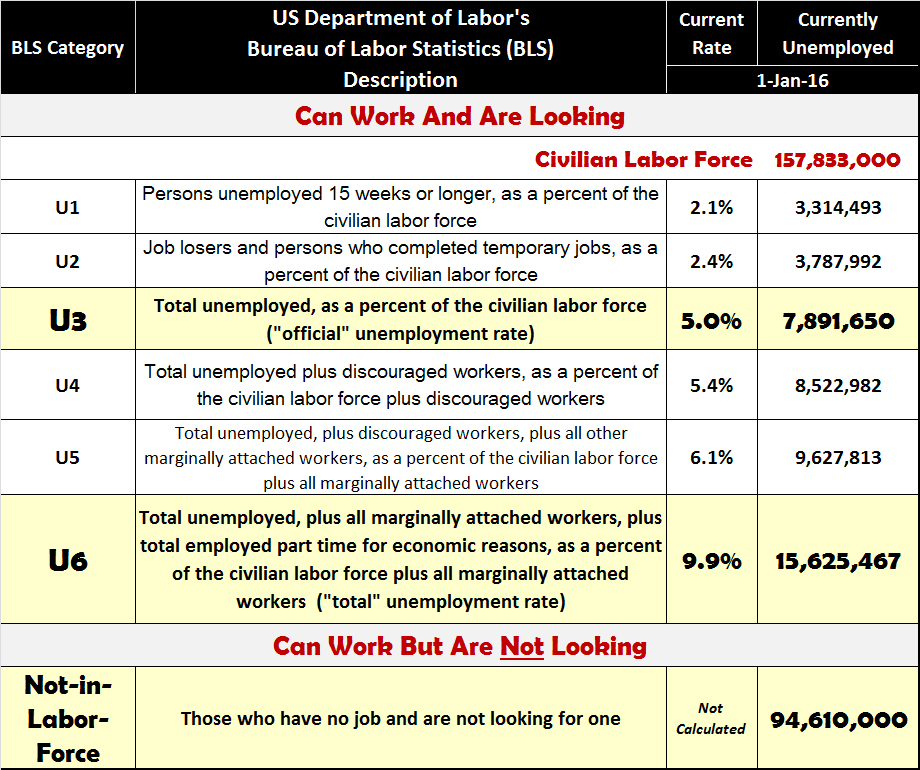
The Bureau of Labor Statistics (BLS) calculates the number of citizens in the Civilian Labor Force (persons classified as Employed or Unemployed) at 157,833,000 (49% of the U.S. population) and in the Not-in-Labor-Force citizens at 94,610,000 (29% of the population).
Within the Civilian Labor Force, the BLS reports on the total number Employed—currently 149,929,000 or 46% of the population—and six unemployment categories as shown below. The most highly reported unemployment category is the U3 “Official” Unemployment category of 7,891,000 unemployed Americans (5.0% of the Civilian Labor Force or 2% of the overall population). For this report, Jobenomics typically uses, for reasons explained herein, the U6 Unemployment category that consists of 15,625 000 citizens (9.9% of the Civilian Labor Force or 5% of the overall U.S. population).
According to BLS, the basic concepts involving the U.S. labor force are relatively straightforward:
- People with jobs are employed.
- People are classified as unemployed if they do not have a job, have actively looked for work in the prior 4 weeks, and are currently available for work. Marginally employed and underemployed personnel, who are actively looking for work, are reported as a subset of the Unemployed, and generally include part-time workers who work less than 35 hours per week.
- Able-bodied adults who are neither Employed nor Unemployed are not in the labor force. Those who have no job and are no longer looking for a job are accounted in the Not-in-Labor-Force category that includes people (over 16 years and older), or so-called “discouraged” workers, who choose not to work.
From a Jobenomics perspective, Not-in-Labor-Force personnel should be classified as unemployed in the same manner that marginalized and underemployed citizens are included in the U6 Unemployment category. Determination whether a person is counted as unemployed should not depend on subjective, and often whimsical, survey questions used to appraise people’s employment intensions.
The four survey questions that government interviewers use to record a person as unemployed include (the bolded words are emphasized when read by the interviewers according to the BLS): [3]
- Do you currently want a job, either full or part time?
- What is the main reason you were not looking for work during the last 4 weeks?
- Did you look for work at any time during the last 12 months?
- Last week, could you have started a job if one had been offered?”
If a person answers yes to all four questions, that person is considered Unemployed. If the answer is no to any of these questions, that person is enrolled in the Not-in-Labor-Force category.
Jobenomics’ 2016 State of the Union’s Labor Force Assessment. To get accurate numbers in today’s labor force, Jobenomics uses a combination of Total Employed, U6 Unemployed and Not-in-Labor-Force obtained from the BLS Employment Situation Summary Report, Tables A-1 and B-1.
Jobenomics contends that able-bodied Americans who can work but don’t work, regardless if they are looking or not, should be considered unemployed for the same reason that “discouraged”, “marginally attached” and “part-time workers for economic reasons” are included in the U6 unemployment category. The reason why the Not-in-Labor-Force and U6 categories should be examined collectively is for governmental transparency and accountability. Sooner or later, the American public will figure out that it is theoretically possible for the United States to have a zero rate of unemployment while simultaneously having zero people employed in the labor force. The reason for this disquieting statement involves how government measures unemployment. To be classified as unemployed, one must be actively looking for work. Able-bodied Americans who are no longer looking are accounted in the obscure, under-reported and arbitrary Not-in-Labor-Force category. A combination of the two categories gives policy-makers and the public a truer picture of the “functionally” unemployed.
In terms of the President’s State of the Union Address on 12 January 2016 and the Republican response, it will be interesting to hear if the dialogue revolves around the U3 “official” unemployment rate and the rate of employment expansion during the post-recession recovery period. From a Jobenomics perspective, resolving the Not-in-Labor-Force challenge is a much more important issue regarding the state of our union, the health of our economy and vitality of our labor force.
Year 2000 Through 2015 U.S. Labor Force Gains/Losses. From the beginning of year 2000 through 2015, the net loss to the U.S. labor force totaled 18.7 million people.
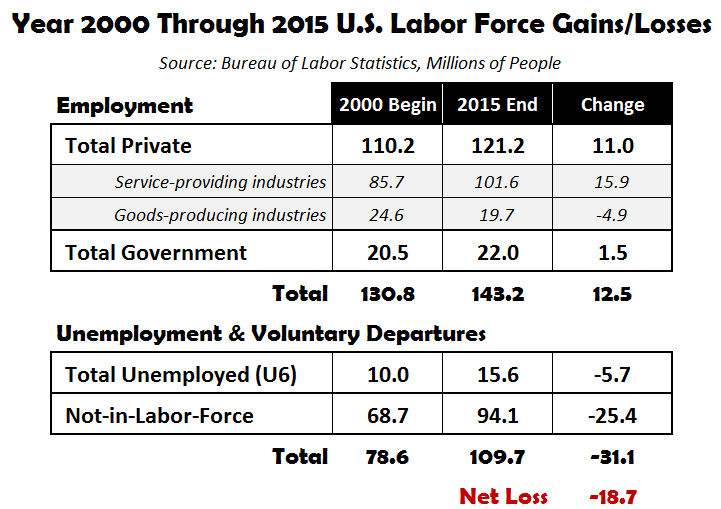
Employment grew from 130.8 million to 143.2 million for a gain of 12.5 million workers.
During the same period, the combined cadre of unemployed and voluntary departures increased from 78.6 million to 109.7 million for a loss of 31.1 million potentially productive workers.
It is also important to note that the U.S. population grew by 40 million people since year 2000—a 15% increase from 2000 through 2015. To understand the effect of population growth, one must look at the BLS’ Employment-to-Population Ratio that is at its lowest level in 30 years. The Employment-to-Population Ratio would be much lower if not for working women who were not engaged in the U.S. labor force in the 1970s as they are today. For more information on this, go to http://Jobenomics.com.
The principle source of employment growth since the beginning of this century has been in the private sector that created 11.0 million new jobs (88% growth or 5.5% growth rate per year) followed by government that created 1.5 million new jobs (12% growth or 0.75% growth rate per year).
Within the private sector, the seven service-providing industries (professional and business services; education and health services; trade, transportation and utilities; financial activities; leisure and hospitality; information; and other services) produced 100% of the jobs growth during the period with 15.9 million new jobs, or growth rate of 1 million new jobs per year. The three goods-producing industries (manufacturing, construction and mining/logging) lost 4.9 million jobs during the period. Jobenomics forecasts that the goods-producing industries will not produce a significant amount of net new jobs in the foreseeable future regardless of amount attention it receives and political rhetoric. For more information why, see http://Jobenomics.com.
Year 2010 Through 2015 U.S. Labor Force Gains/Losses. From the beginning of year 2010 through 2015, the post Great Recession recovery period managed by the Obama Administration, generated a net gain of 13.8 million people in the U.S. labor force.
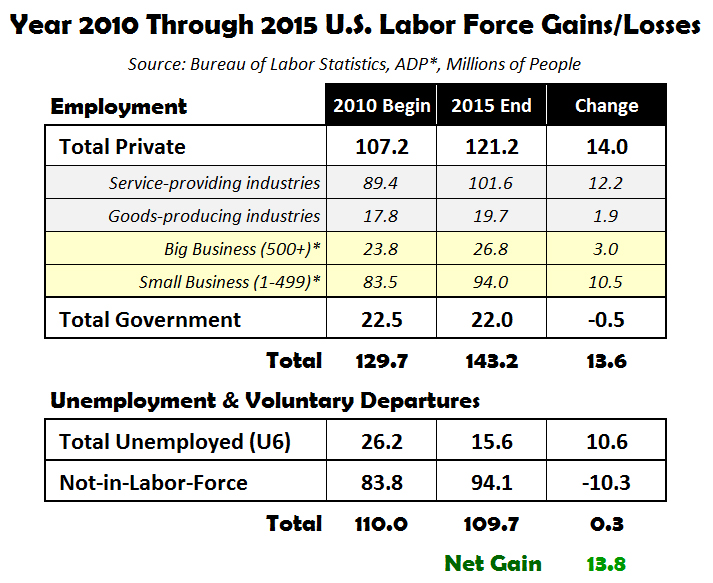
Employment grew from 129.7 million to 143.2 million for a gain of 13.6 million workers. During the same period, the combined cadre of unemployed and voluntary departures remained virtually the same (110.0 million in year 2010 versus 109.7 million as of December 2015) with reductions of the number of unemployed being replaced by voluntary departures.
The principle source of employment growth year 2010 through 2015 has been in the private sector that created 14.0 million new jobs (13% growth or 2.2% growth rate per year) followed by government that lost 0.5 million new jobs (a negative 2% growth or 0.37% growth rate per year).
Within the private sector, the seven service-providing industries produced 87% of the jobs growth during the period with 12.2 million new jobs, or growth rate of 2 million new jobs per year. The three goods-producing industries also generated 1.9 million new jobs during the period, or 13% of the new jobs generated during the period.
Private sector service-providing industries and small businesses have been work horses of the economic recovery and principle sources of new jobs. Today, private sector businesses employ 85% of the U.S. labor force, of which 100,590,000 Americans (70.9%) have service-providing jobs and 19,651,000 (13.7%) have goods-producing jobs. As reported by the ADP National Employment Report[4], which surveys 400,000 U.S. businesses each month, small businesses created over 3.5 times as many jobs as big businesses in the last six years, 10.5 million versus 3.0 million respectively.
Over the last six years, the highly publicized “official” U3 unemployment rate was cut in half, from 10% to 5%, with a lot of fanfare. Similarly, the “total” U6 unemployment rate fell by 43%, from 17.3% to 9.9%, with a reduction of 10.6 million people in the U6 category. However, many of these formerly unemployed simply quit looking for work and were recounted in the BLS Not-in-Labor-Force category that grew by 10.3 million people, essentially wiping out the positive U6 gains.
From a policy-making perspective, the 94.1 million Americas who are no longer looking for work needs significantly more attention than the 15.6 million Americans who are still looking or are underemployed. The current BLS Employment Situation Summary Report states that 95% of the Americans in today’s Not-in-Labor-Force “do not want a job now”.[5] Why should they? America provides generous welfare and means-adjusted programs that are not tied to workfare like the most generous European nations require. Rather than hiring, U.S. corporations are preoccupied using profits on mergers and acquisition, expanding overseas and relocating corporate headquarters in foreign countries as a tax-saving measure. Learning new skills to compete for 5.1 million open America jobs[6] takes lots of effort, making it much easier to drop out of the labor force, go on the dole and pursue alternative ways of living.
Year 2015 U.S. Labor Force Gains/Losses. In 2015, the U.S. labor force suffered a net gain of 3.3 million.
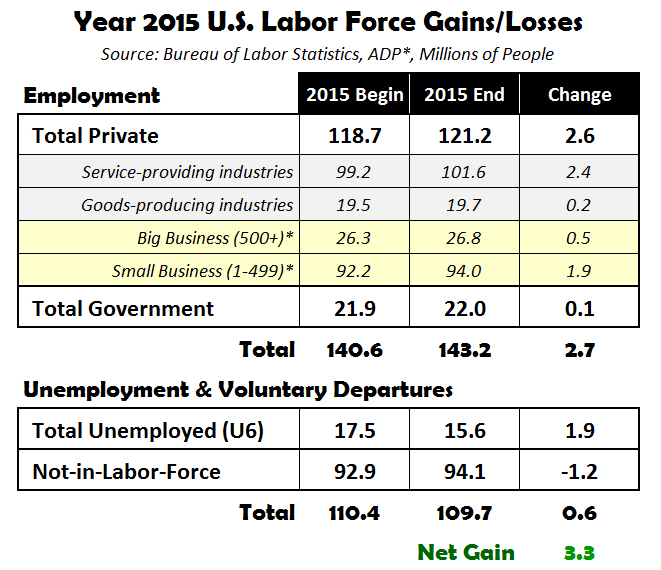
Employment grew from 140.6 million to 143.2 million workers for a gain of 2.7 million jobs, which was supplemented by a gain of 0.6 million in the combined U6/Not-in-Labor-Force cadre, which remained at relative the same level from the beginning of the year, 110.0 million to 109.7 million respectively. While the U6 unemployment rolls decreased by 1.9 million people, 1.2 million people quit looking for work and voluntarily departed the U.S. labor force. Private sector service-providing industries and small businesses continued to the dominant forces in labor force expansion producing 2.4 million (90%) and 1.9 million (70%) of the 2.7 new jobs created during the year.
From policy and economic growth perspectives, 2016 State of the Union deliberations should contain an order of magnitude more labor force programs oriented to service industry vitality, small business hiring incentives and small business creation than programs for big businesses and government jobs that are unlikely to create a meaningful number of new jobs. In fact, big business is likely to downsize even further in 2016 consider the historically high number and value of corporate mergers and acquisitions, international pursuits and corporate inversions—all of which have negative consequences for U.S. labor force expansion and prosperity. Small business expansion provides the most bang for the buck for strengthening the U.S. labor force and stemming the erosion of the American middle class.
[1] Labor force data in this document is taken from the latest U.S. Bureau of Labor Statistics (BLS) Employment Situation Summary Report unless otherwise footnoted. The majority of BLS data used is from Table A-1, Household Data, http://www.bls.gov/news.release/empsit.t01.htm, and Table B-1, Establishment Data, http://www.bls.gov/webapps/legacy/cesbtab1.htm.
[2] U.S. Census Bureau, U.S. and World Population Clock, http://www.census.gov/popclock/
[3] BLS, Who is not in the labor force?, http://www.bls.gov/cps/cps_htgm.htm#nilf
[4] ADP Research Institute, National Employment Report, December 2015, http://www.adpemploymentreport.com/
[5] BLS, Table A-38, Persons not in the labor force by desire and availability for work, age and sex, retrieved 10 January 2016, http://www.bls.gov/web/empsit/cpseea38.htm
[6] BLS, Job Openings and Labor Turnover Report, Table 7, Job openings levels and rates by industry and region, retrieved 10 January 2016, http://www.bls.gov/news.release/jolts.t07.htm