
Jobenomics U.S. Unemployment Analysis: Q2 2016
By: Chuck Vollmer
Contact information: [email protected]
Download 50-page report at:
Jobenomics U.S. Unemployment Analysis - Q2 2016 - 6 August 2016
6 August 2016
Jobenomics reports on U.S. unemployment and employment size, characteristics and trends. This Analysis focuses on how the U.S. government reports on unemployment and income statistics, why Americans who can work chose not to work, and the impact of 109.8 million non-working able-bodied citizens are having on the U.S. labor force and economy. The Jobenomics Employment Analysis focuses on the U.S. labor force, business and job creation, and transformative trends—with emphasis on 60 million workers in the rapidly growing contingent workforce.
Executive Summary
According to the U.S. Bureau of Labor Statistics (BLS), the U.S. labor force has three statistical categories: Employed, Unemployed and Not-in-Labor-Force. Understanding the dynamics between these categories is required to understand the American labor force and ultimately the U.S. economy.
From an unemployment perspective, policy-makers, decision-leaders and the American public must address three major trends: (1) growing voluntary workforce departures, (2) contingent workforce expansion, and (3) below average wage earner issues that are becoming more pervasive.
Sooner or later, the American public will figure out that it is theoretically possible for the United States to have a zero rate of unemployment while simultaneously having zero people employed in the labor force. The reason for this disquieting statement involves how government measures unemployment. To be classified as unemployed, one must be looking for work. Able-bodied Americans who quit looking and voluntarily depart the workforce are classified in a nebulous and obscure Not-in-Labor-Force category that few people comprehend.
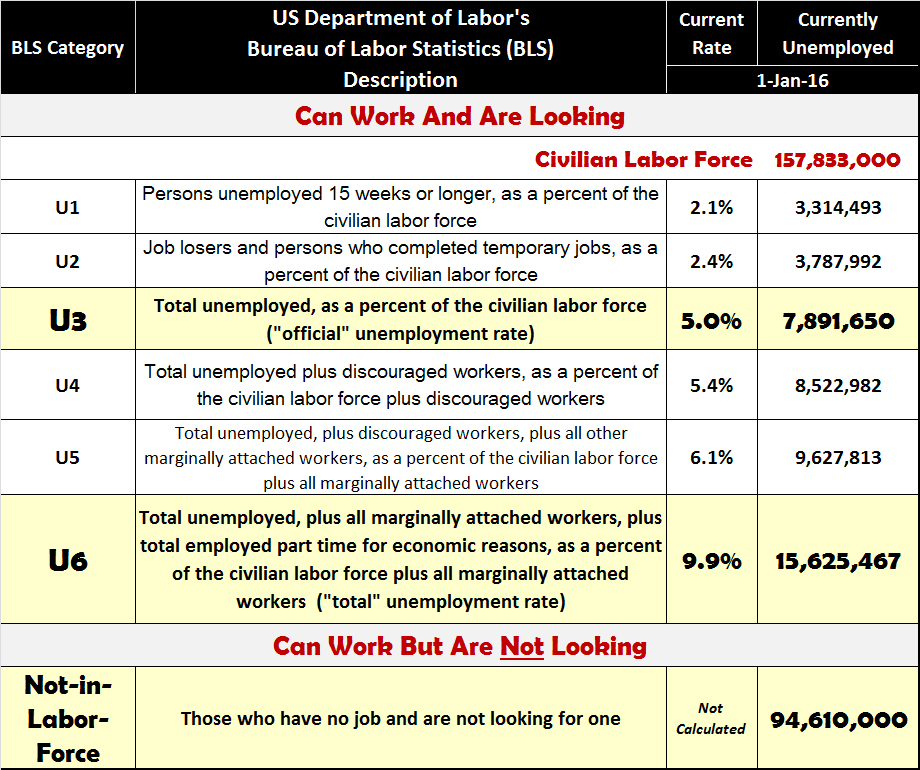
Six unemployment categories (U1 through U6) are reported monthly by the BLS. Each category requires that an individual must be actively looking for work. These categories are calculated as a percent of the Civilian Labor Force (Employed + Unemployed). The BLS also calculates the number of able-bodied adults who can work, but are not looking for work, in a category entitled Not-in-Labor-Force, which is not part of the Civilian Labor Force (159 million), but part of the larger Civilian Noninstitutional Population (254 million), which is a subset of the entire U.S. population (324 million).
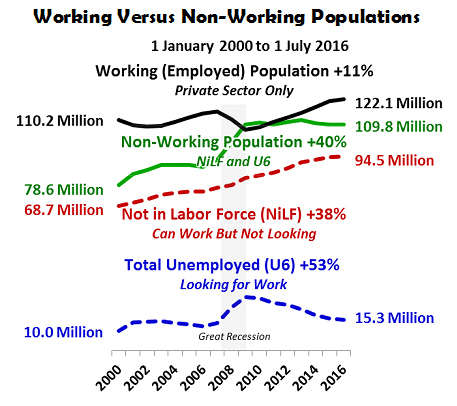
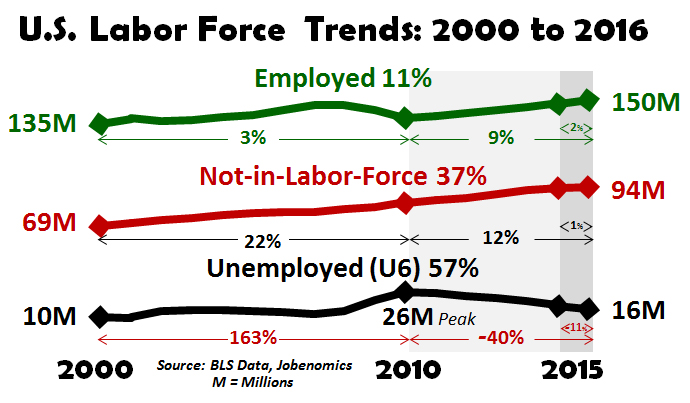
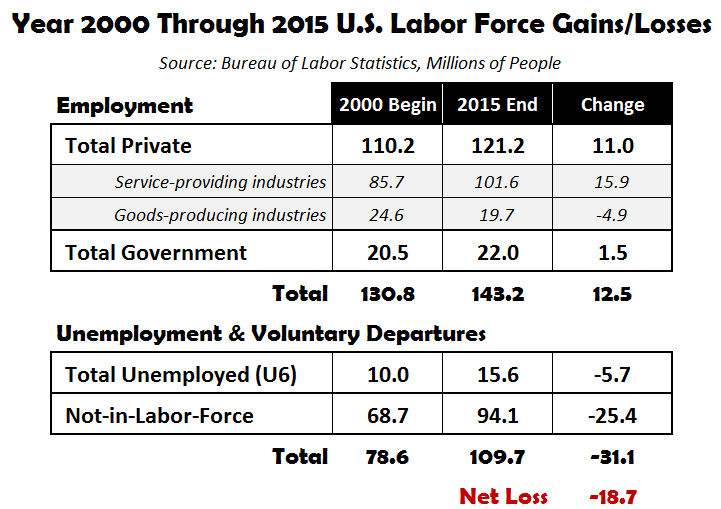
The latest BLS Employment Situation Summary[1] reports that 122.1 million Employed Americans work in the private sector[2] versus 109.8 million citizens who are Unemployed (U6, defined as total unemployed and underemployed people who are looking for work) and Not-in-Labor-Force (NiLF, defined as able-bodied adults who are capable of working but not looking for work for a variety of reasons). From 1 January 2000 to 1 July 2016, the working population (Private Sector Employed) increased by 11% compared to a 40% rise in the non-working population (U6/NiLF). The non-working population briefly exceeded the working population during the 2007-2009 Recession and is likely to outnumber the working population by 2024 if current trends exist, or earlier if an economic downturn occurs.
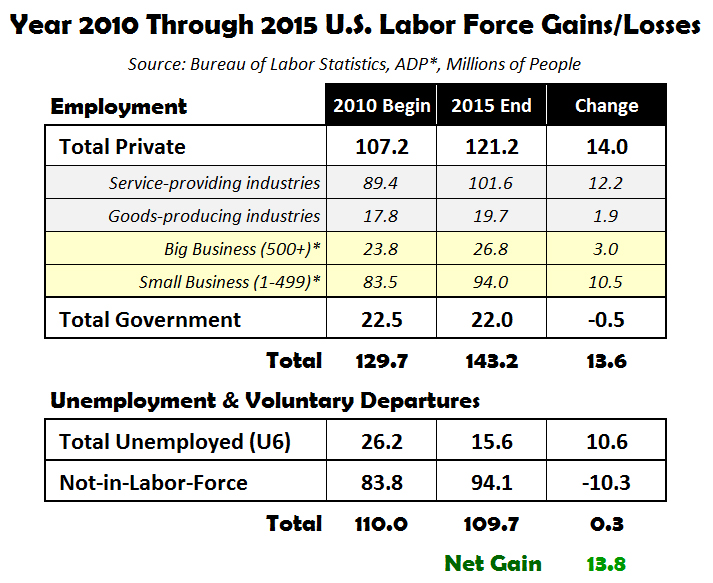
The U6 population includes the long-term unemployed (U1), job losers and temporary workers (U2), total unemployed workers (U3), discouraged workers (U4), marginally attached workers (U5) and underemployed workers who work part-time because they can’t find a full-time job. It is important to remember that a person must be actively looking for work to be counted as unemployed in any of the six BLS unemployment categories. In January 2000, the U6 population was 9,953,000. The height of the Great Recession, U6 peaked at 26,440,000 April 2010, an increase of 166% since the turn of the Century. Since peak through Q2 2016, the U6 dropped by 11.2 million people to 15,252,000 today. Despite all the political fanfare, 15,252,000 unemployed, underemployed and marginally-attached citizens still represent 53% more people out of work than existed 16 years ago.
Able-bodied adults who are neither employed nor unemployed are not in the labor force. Those who have no job and are no longer looking for a job are accounted by the BLS in the Not-in-Labor-Force category. From 2000 through Q2 2016, the Not-in-Labor-Force cadre grew from 68,655,000 to 94,517,000, an increase of 26 million citizens who more often than not are dependent on public/familial assistance.
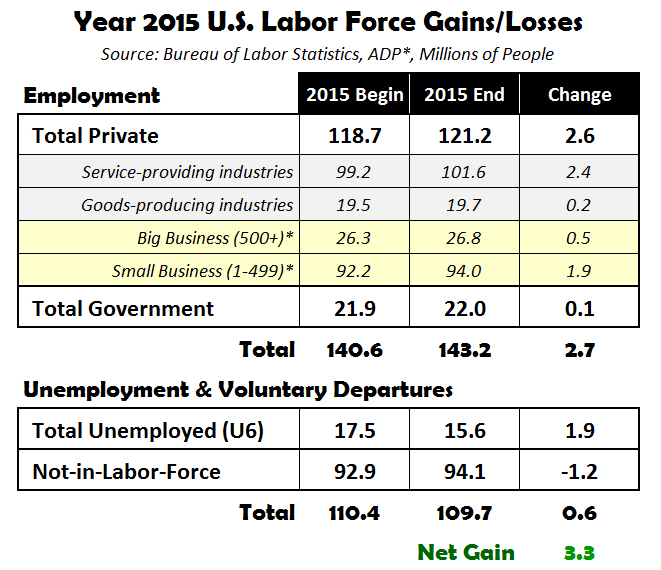
Since the post-recession April 2010 U6 peak in Q2 2010, the Not-in-Labor-Force cadre grew by 11.8 million, which offset the 11.2 million people that were no longer part of the U6 population. Today, the Not-in-Labor-Force exceeds the U6 Unemployed cadre by 6-times (94,517,000 versus 15,252,480) and 12-times the number of people enrolled in the U3 Unemployment category that is generally referred to as the “officially unemployed”. This great disparity is rarely addressed by policy-makers, analyzed by decision-makers or mentioned by the media’s talking-heads, all of whom focus almost entirely on the “Official U3 Unemployment Rate” that is now at a post-recession low of 4.9%.
The ability to work should be the determining factor for unemployment as opposed to whether or not a person is looking for work. Jobenomics contends that all able-bodied Americans who can work, regardless if they are looking or not, should be considered “functionally” unemployed. Functional is defined as capable of working. An able-bodied adult who is capable of working but chooses not to work should be considered unemployed for the same reason that “discouraged”, “marginally attached” and “part-time workers for economic reasons” are included in the U4, U5 and U6 Unemployment categories.
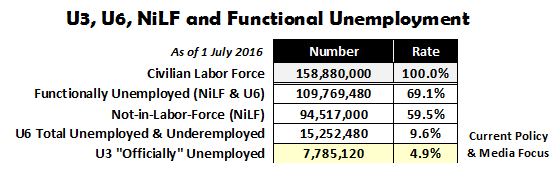
This chart shows U3, U6, NiLF and the Jobenomics Functionally Unemployed numbers in relation to the Civilian Labor Force. The 4.9% U3 and 9.6% U6 are percentages of the Civilian Labor Force that consist of Employed and Unemployed workers who are currently employed or looking for work.
Hypothetically, if compared to the Civil Labor Force, the Not-in-Labor-Force cadre would equate to 59.5%, and the Jobenomics Functionally Unemployed (NiLF & U6) would be 69.1%, which gives one a sense of how large a challenge that the Not-in-Labor-Force cadre presents to the U.S. labor force and the American economy.
In order to achieve a sustainable economy and labor force, U.S. policy-makers and decision-leaders must shift their attention from an U3/U6 unemployment focus to understanding the reasons that able-bodied Americans who are capable of working are no longer looking for work and joining the ranks of those no longer in the U.S. labor force. When as many people drop out of the labor force as enter it, the U.S. economy cannot grow as it should.
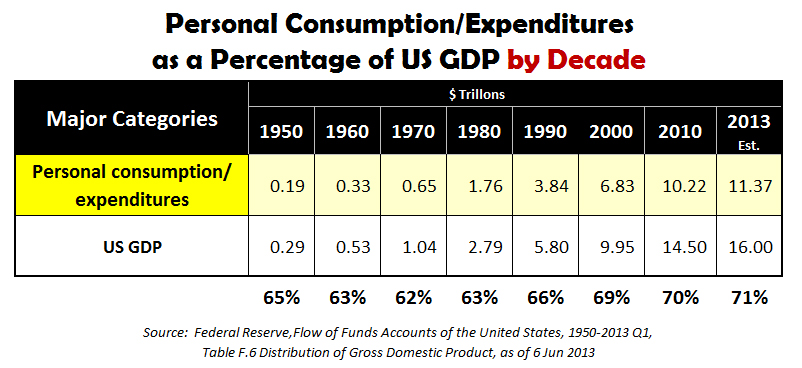
Most economists believe that economic growth depends on job and GDP growth. The ideal rate for U.S. GDP growth is 2% to 3%. For the United States, a mature economy, sustained GDP growth significantly over 3% tends to led to overheating and bubbles. Anything below 2% is considered sclerotic growth and makes the economy vulnerable to financial downturns. During the post-WWII recovery, U.S. GDP grew at an average rate of 3.5% which created tens of millions of new jobs each decade. Since 2000, U.S. GDP averaged 1.76%. During the post-recession recovery period to today, U.S. GDP averaged 2.0% but is now slowing significantly. In Q1 2016, U.S. GDP grew by an abysmal 0.8%. Q2 2016 is estimated to be not much better at 1.2%. Consequently, the combined GDP rate for 2016 is only 1.0%—an alarmingly low rate of growth.[3]
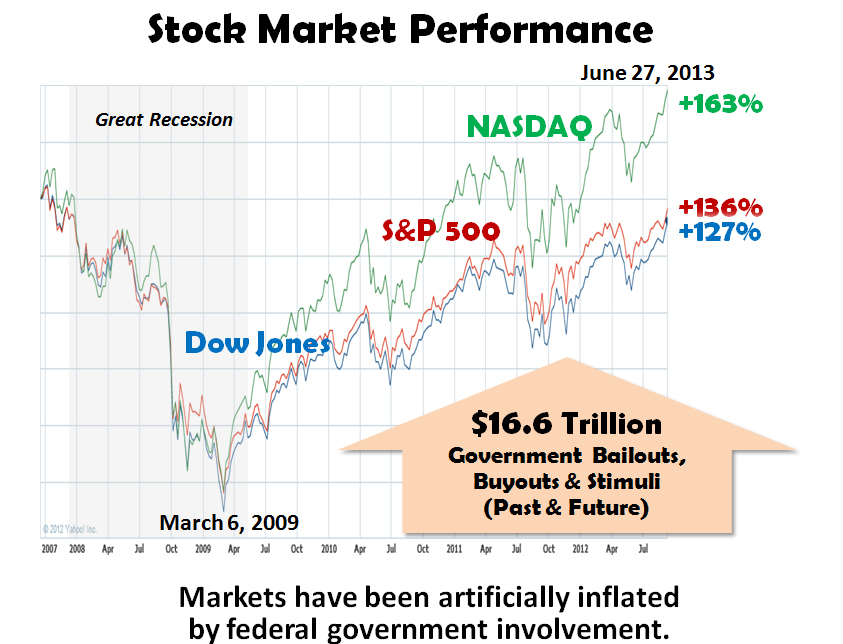
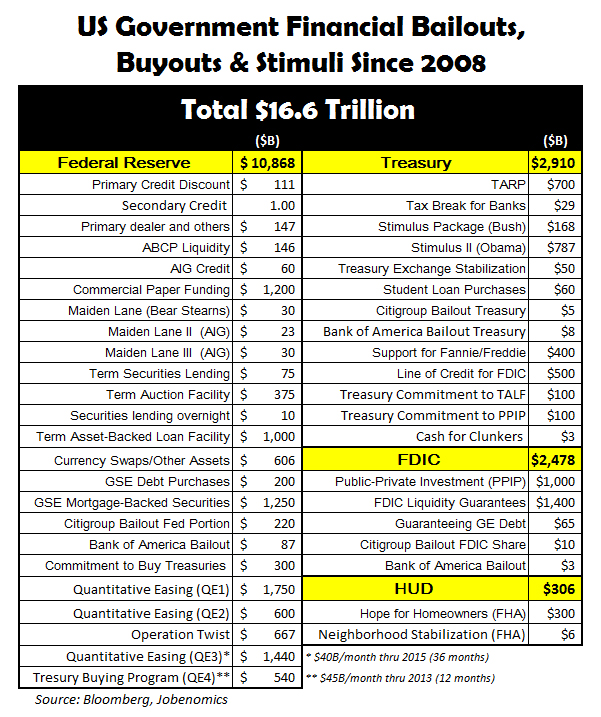
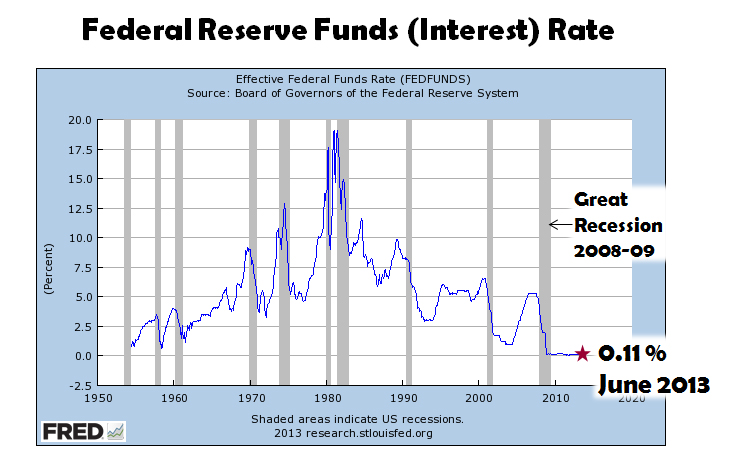
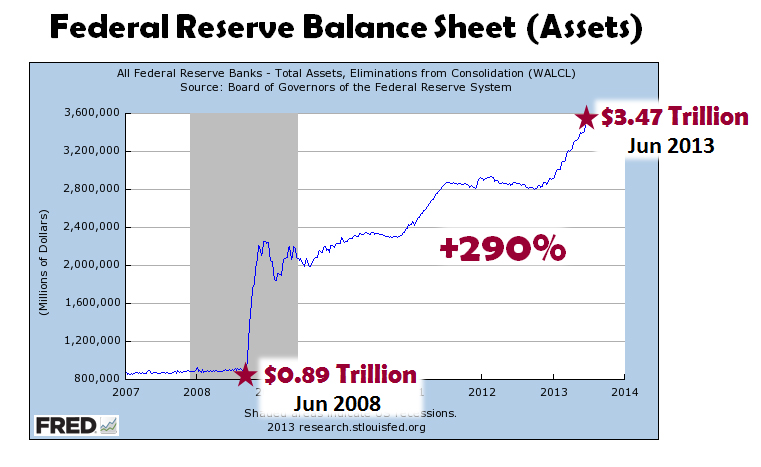
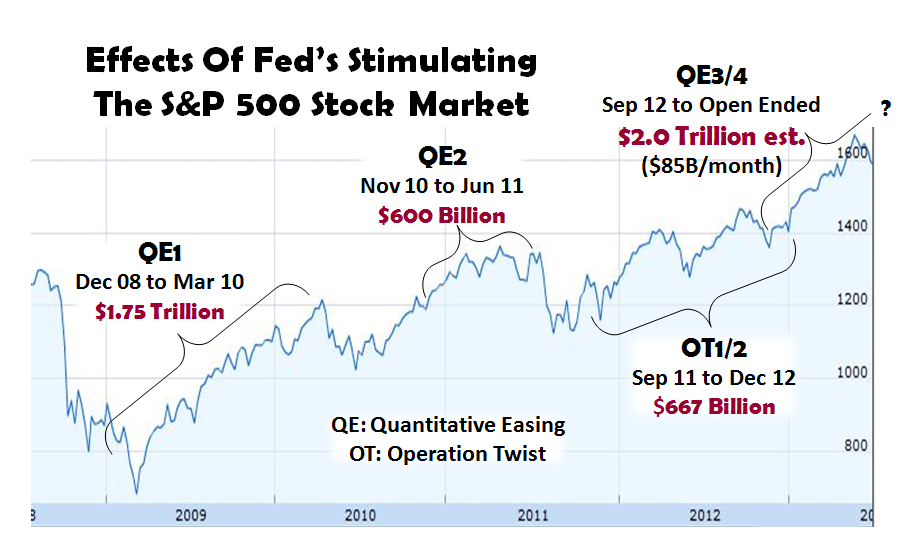
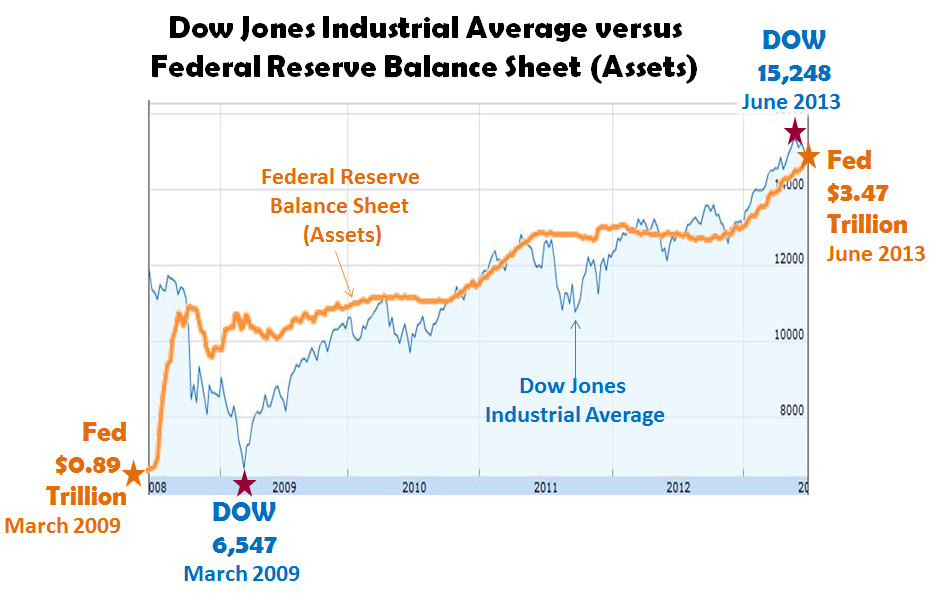
As far as the future, many economists feel that a recession (two quarters below 0% GDP growth) is likely. The United States averages 3 financial downturns and 1.7 recessions per decade over the last 7 decades. This decade (2010s) has been recession-free largely due to government deficit spending, increasing money supply, low interest rates, stimulus packages, bailouts, buyouts and foreign investment. Now that the era of easy money is coming to an end, an anemic U.S. economy will have to operate under its own steam.
The period of frail GDP growth from 2000, has dramatically impacted the American middle-class and the U.S. labor force that gained 13,395,000 workers but lost 25,862,000 through voluntarily departures. To make matters worse, the U.S. population grew by 44 million citizens since year 2000, which places a greater burden on taxpaying workers. For most American workers, real wages (purchasing power) have not increased for decades and are not projected to improve soon.
Another alarming trend involves the dramatic rise in the contingent workforce, which now stands at 60 million employed workers, or 40% of the Private Sector Labor Force. The BLS defines the contingent workforce as the portion of the labor force that has “nonstandard work arrangements” or those without “permanent jobs with a traditional employer-employee relationship”. The Jobenomics U.S. Contingent Workforce Challenge Report estimates that the contingent workforce could be the predominant source (over 50%) of employed U.S. labor by 2030, or sooner, depending on economic conditions and seven ongoing labor force trends.[4]
The contingent workforce is comprised of two general categories: core and non-core. Core contingency workers include agency temps, direct-hire temps, on-call laborers and contract workers. Core workers generally represent low wage earners that have nonstandard work arrangements out of necessity, often subjected to exploitation, and usually not entitled to traditional employer-provided retirement and health benefits. The non-core category includes independent contractors, self-employed workers and standard part-time workers who work fewer than 35 hours per week. Non-core workers generally seek nonstandard work agreements as a matter of choice.
Jobenomics views the non-core workforce as a positive economic force that will grow significantly via the emerging digital economy. On the other hand, Jobenomics views the core contingency as a major labor force challenge as more and more citizens work for substandard wages, become frustrated, and seek alternative sources of income. The contingent workforce is addressed in this analysis from a Not-in-Labor-Force perspective and discussed in detail from an overall employment perspective in the Jobenomics Employment Analysis.[5]
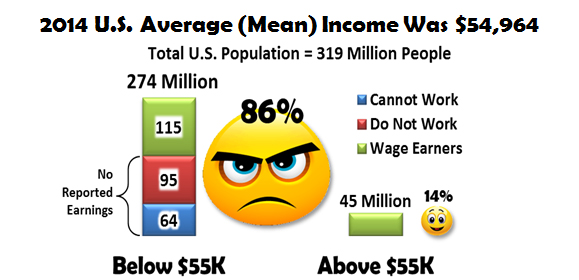
Contingent work, low wages and the attractiveness of the U.S. welfare/means-adjusted earnings programs are fueling the rapid and increasing exodus of citizens from the U.S. labor force. In 2014, 86% of all Americans (including workers with earnings, Not-in-Labor-Force and those that cannot work, such as children, caregivers, disabled, elderly, etc.) made below average income. Out of a total of 160.1 million full-time and part-time American workers with earnings, 115.2 million workers (72%) make less than the U.S. mean (average) income of $54,964.
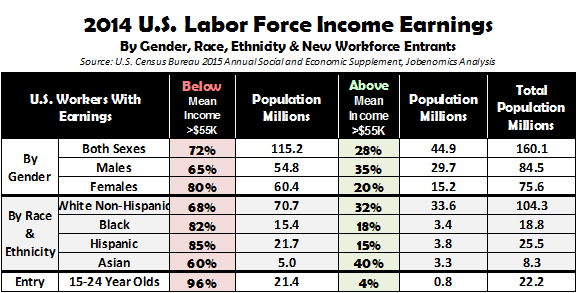
As shown, the demographics with the greatest need and potential are women, minorities, new workforce entrants and the growing cadre of poor white males. 96% of new workforce entrants aged 15 to 24, 85% of Hispanics, 82% of Blacks, 80% of Females, 68% White Non-Hispanics, 65% of Males and 60% of Asians earn below average wage. The good news is that both women-owned and minority-owned firms have been growing at rates far greater than the national average.
A major reason for Not-in-Labor-Force growth is due to the growing attractiveness of welfare and entitlement benefits. The U.S. federal government funds 126 separate programs targeted at low income people. State, county, and municipal governments offer additional welfare and public assistance programs. Combined welfare benefits pay more than minimum wage jobs in 35 states—in many cases, significantly more. 35 U.S. states offer welfare packages (not including Medicaid) more generous than the most lavish and liberal European countries. 39 states pay welfare recipients more than the starting wage for a secretary and in 11 states more than the first year wage for a teacher.
Once a person becomes dependent on welfare, transition to workfare becomes difficult. Loss of critical workforce skills increase proportionally to the length of time a person is not working. Most of the 5 million open employment positions in the United States are due to a deficit of skills and the capability to perform effectively in a working environment. Prolonged dependency generates anger, grievances, activism, violence and counter-cultural lifestyles.
In today’s consumption-based and market-driven society, there is never enough public or familial assistance to satisfy the financially disaffected. Consequently, those who need additional income often turn to temporary jobs, barter, the underground economy as well as illicit lifestyles (gangs, drugs and crime) rather than legitimate forms of long-term employment. Jobenomics contends that workfare is the only reasonable alternative to welfare. The problem is how to motive and facilitate this transition.
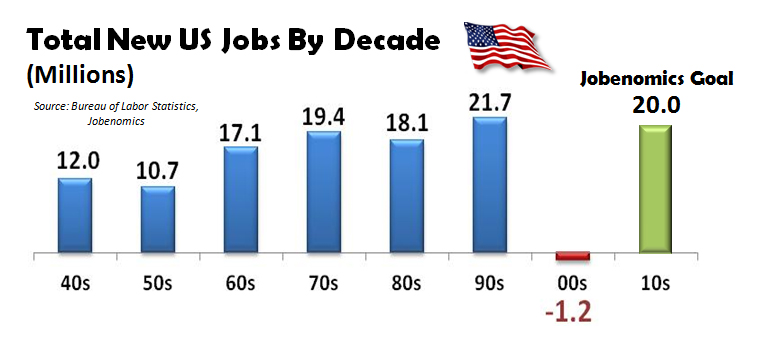
The solution to growing America’s economy, healing the middle-class and strengthening the labor force involves putting the U.S. small business engine into over-drive. Energizing existing businesses and creating new small and self-employed businesses could create 20 million net new jobs within a decade. To this end, Jobenomics is working with a number of cities to implement Jobenomics Community-Based Business Generators to mass produce startup businesses.
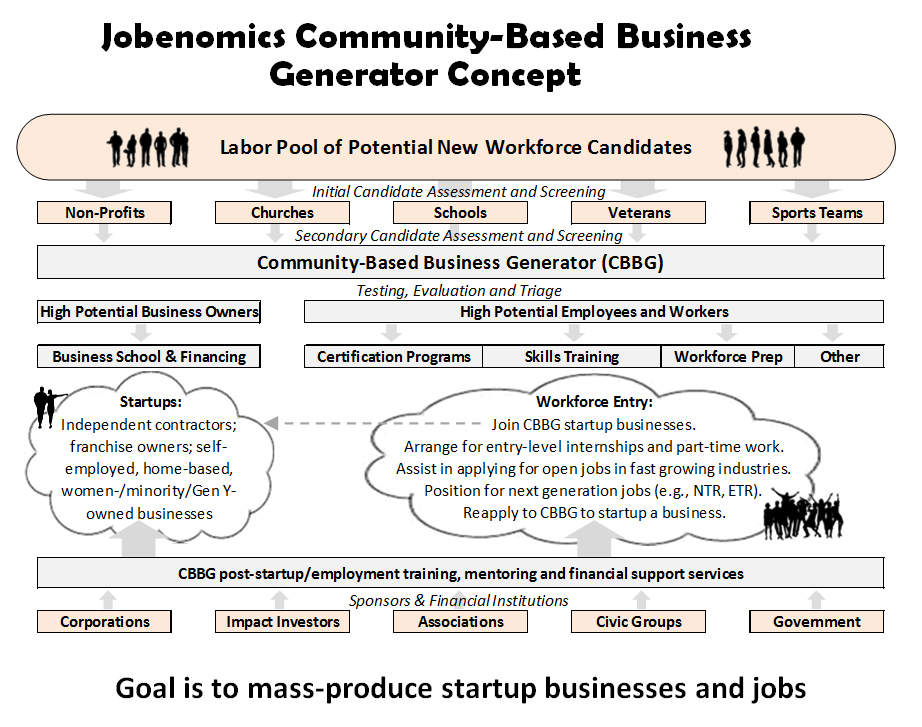
Jobenomics Community-Based Business Generators mass-produce startup businesses by: (1) working with community leaders to identify high-potential business owners and employees, (2) executing a due diligence process to identify potential high quality business leaders and employees, (3) training and certifying these leaders and employees in targeted occupations, (4) creating highly repeatable and highly scalable “turn-key” small and self-employed businesses, (5) establishing sources of startup funding, recurring funding and contracts to provide a consistent source of revenue for new businesses after incorporation, and (6) providing mentoring and back-office support services to extend the life span and profitability of businesses created by the Jobenomics Community-Based Business Generators.
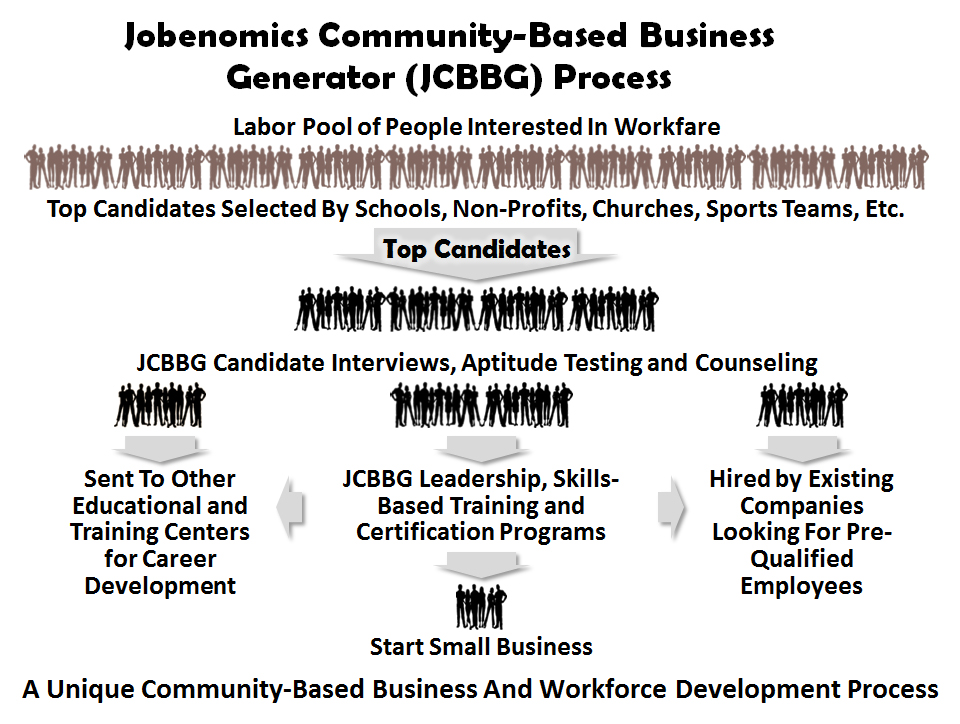
Starting a notional pool of 10,000 candidates, Jobenomics will work with local civic organizations (churches, non-profits, sports teams, etc.) to identify and nominate the top 10% to 25% candidates, who they know, for the Jobenomics Community-Based Business Generator program. This is the first stage of the due diligence process to separate the proverbial wheat from the chaff. These nominees will then be subjected to standard aptitude and attitude tests in order to willow the list down to several hundred trainees who we believe that could become high-quality employees and business leaders. Approximately 10% would undergo business school training and certification (goal is to startup a locally-owned business) and 90% some form of skills-based training and certification that would be needed in our new startup businesses. If each startup employed 10 people, 20 to 30 new small businesses would be created.
While the overall goal is to mass-produce small businesses, the Jobenomics Community-Based Business Generator will help all people who enter the program to find meaningful employment. Many of the initial candidates are likely to prefer working for existing companies rather than going through the Jobenomics process. Anticipating this, Jobenomics will implement a “pipeline” to connect these individuals who have undergone some level of due diligence to companies that are hiring. A common complaint that Jobenomics often hears from companies is that they have a very hard time finding good people who want to work and who have the right attitudes/aptitude for work. Consequently, Jobenomics Community-Based Business Generators will utilize a nationally recognized pipeline system that has recently matched hundreds of thousands veterans with employers.
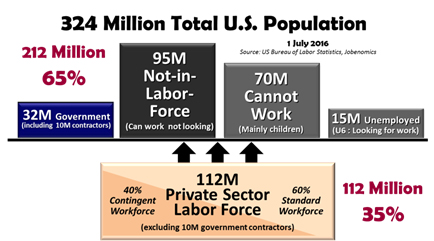
In summary, the U.S. economy cannot be sustained by only 35% of the population that is eroding in terms of size, wages and income potential.
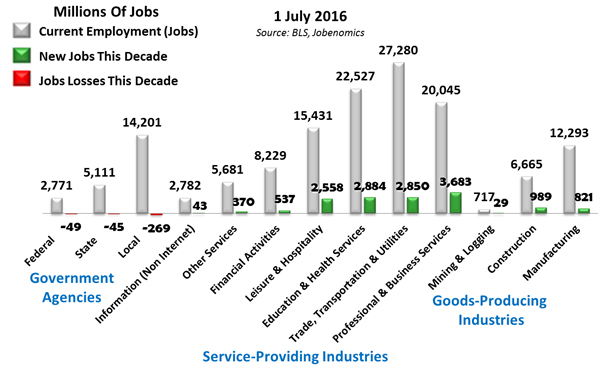
The private sector labor force produces the majority of American jobs, goods, services and revenue needed to sustain economic growth. 112 million private sector workers support 32 million government workers and contractors, 95 million able-bodied people who can work but chose not to work, 70 million who cannot work and the 15 million unemployed and underemployed. Of the 112 million employed Americans in the private sector, approximately 60% are standard full-time workers and 40% are part-time and independent continent workers.
If American policy-makers and decision-leaders are serious about revitalizing the eroding middle-class, they must address the growing voluntary workforce departures, contingent workforce and below mean income issues. Jobenomics believes that the place to start is with demographics with the greatest need and potential (i.e., women, minorities, new workforce entrants and the growing cadre of poor white males). Jobenomics suggests that the 2016 Presidential candidates, in both parties, should make solutions to these labor force issues their top priority.
[1] U.S. Bureau of Labor Statistics, Employment Situation Summary, http://www.bls.gov/news.release/empsit.nr0.htm
[2] Government workers pay taxes just like private sector workers. However, government relies on tax revenue to pay salaries. Hence, Jobenomics often uses private sector figures when discussing the relative strength of the U.S. labor force and the economy.
[3] U.S. Bureau of Economic Analysis, Gross Domestic Product: Second Quarter 2016 (Advance Estimate)
Annual Update: 2013 through First Quarter 2016, 29 July 2016, http://www.bea.gov/newsreleases/national/gdp/gdpnewsrelease.htm
[4] http://jobenomicsblog.com/wp-content/uploads/2016/05/U.S.-Contingent-Workforce-Challenge-4-April-2016.pdf
[5] http://jobenomicsblog.com/jobenomics-u-s-employment-analysis-Q2-2016/


")


