Jobenomics U.S. Employment Analysis: Q2 2016

Q2 Employment Cover Q2 Employment ToC

Jobenomics U.S. Employment Analysis: Q2 2016

By: Chuck Vollmer

31 July 2016

Download 100-page report at:

Jobenomics U.S. Employment Analysis - Q2 2016 - 31 July 2016

Jobenomics reports on U.S. employment and unemployment size, characteristics and trends.   This Employment Analysis focuses on the U.S. labor force, business and job creation, and transformative trends—with emphasis on the 60 million workers in the rapidly growing, and underreported, contingent workforce.  The companion Unemployment Analysis focuses on how the U.S. government reports on unemployment and income statistics, why Americans who can work chose not to work, and the impact of 109.8 million non-working able-bodied citizens are having on the United States.

Executive Summary

Q2 Employment Summary


Current U.S. employment and job gains/loss statistics since the beginning of the decade are shown above.  Between 1 January 2010 and 1 July 2016, the United States has created 14,401,000 new jobs with a net gain of 14,764,000 in the private sector and a net loss of 363,000 in government employment.  81.1% of all new jobs this decade were produced by four service-providing industries (Professional & Business Services; Education & Health Services; Trade, Transportation & Utilities; Leisure & Hospitality).  Manufacturing and Construction industries contributed 5.6% and 6.7%, respectively. 77.9% of all Americans are now employed by small businesses that created 77.7% of all new jobs this decade.  In June 2016, small businesses created 85.4% of all new jobs with micro-businesses (1-19 workers) employing 69% more Americans than all large corporations with over 1000 employees.

While these employment statistics are positive, they are offset by three trends that threaten economic growth and stability.  These disturbing trends include voluntary workforce departures, contingent workforce growth and sclerotic GDP growth.

  • Voluntary Workforce Departures. In Q2 2016, the U.S. labor force lost 593,000 more workers than it gained due to the exodus of frustrated job-seekers and able-bodied workers to welfare and alternative lifestyles. Since year 2000, 25,862,000 able-bodied workers departed versus 13,395,000 workers who joined the labor force for a net loss of 12,467,000 workers.  This net loss does not include the number of unemployed (2.1 million more people are unemployed in 2016 than 2000) or population growth (42 million additional Americans today compared to 2000).
  • Contingent Workforce Growth. Contingent workers are defined by the U.S. government as “non-standard” workers who work part-time by necessity (temps and day workers) or by choice (free lancers and self-employed). Today, the contingent workforce is approximately 60,000,000 employed Americans or 40% of the total employed workforce.  By 2030, this number will grow to 80,000,000 or 50% of the U.S. employed workforce—a trend that is largely unknown to U.S. policy-makers and the American public.
  • Sclerotic GDP Growth. Most economists believe that economic growth depends on job and GDP growth. The ideal rate for U.S. GDP growth is 2% to 3%.  Since 2000, U.S. GDP averaged a sclerotic 1.76%.  During the post-recession recovery period to today, U.S. GDP averaged only 2.0%.   In Q1 2016, U.S. GDP grew by an abysmal 0.8%.  Q2 2016 is estimated to be not much better at 1.2%.

Job creation is the number one issue facing U.S. in regard to economic growth, sustainment and prosperity.  Jobs do not create jobs, businesses do, especially small businesses.  Unfortunately, America is focused on big business and government employment solutions that have not been very effective growing the U.S. labor force.  In fact, the U.S. labor force is in a state of decline as evidenced by the eroding middle-class and the transformation from full-time to contingency workers.

324 Million

35% of all Americans financially support the rest of the country.   As of 1 July 2016, out of a U.S. population of 324 million, 112 million private sector workers support 32 million government workers and government contractors, 95 million able-bodied people who can work but chose not to work, 70 million who cannot work, and 15 million unemployed and underemployed.   The U.S. economy is not sustainable with only 35% supporting an overhead of 65%.  The growing contingent labor force, which consists of mostly lower paid wage earners, makes the overhead burden even more precarious.  More people with livable wages and greater discretionary income must be productively engaged in the private sector labor force for the U.S. economy to flourish.

Workforce Education/Training Challenge

Workforce Education/Training Challenge

www.Jobenomics.com

By: Chuck Vollmer

1 August 2016

Workforce Education vs Training An 11-page Workforce Education/Training Challenge White Paper is available at: Workforce Education versus Training Challenge 1 Aug 2016

Executive Summary.  The Father of American Education, Horace Mann, stated that “Education then, beyond all other devices of human origin, is the great equalizer of the conditions of men, the balance-wheel of the social machinery.”  While Jobenomics agrees, the educational paradigm required for yesteryear’s workforce development may not be appropriate for many in today’s workforce.  Today the U.S. labor force is increasingly characterized by income inequality, an eroding middle class and a growing contingent workforce that traditional degree-oriented educational programs have not been able to mitigate.  More skills-based training and certification programs are needed.

The bifurcation of American society into haves and have-nots, skilled and unskilled, and hopefuls and the hopeless is a major educational/training challenge.  To those at the top of the American economic pyramid, the old paradigm of “get a degree to get a job, get a better degree to get a better job” is more important than ever.  On the other side of the ledger, to those at the bottom of the economic pyramid, more workforce technical and social skills training are needed to stem the increasing exodus to welfare and alternative lifestyles.  For many at the bottom getting a postsecondary degree is a bridge too far.  Earning a high school degree no longer guarantees a livable wage or viable career.

Education is defined as the process of imparting or acquiring general knowledge, developing powers of reasoning and judgment, and generally of preparing intellectually for mature life.  Education generally involves learning theory.  In the United States, there are four levels of education: pre-primary, primary, secondary and tertiary.  Pre-primary education includes kindergarten, nursery schools, preschool programs and child/day care centers.  Primary refers to first through eighth grades.  Secondary usually refers to the last four years of high school (ninth through twelfth grade).  Tertiary, also called postsecondary, refers to academic pursuit undertaken after high school.  Primary and secondary education are compulsory (required by law), whereas pre-primary and postsecondary education is not.  Postsecondary undergraduate programs, generally include associate and bachelor (baccalaureate) programs.  Postsecondary post-baccalaureate pursuits generally include masters and doctorate programs.  Primary, secondary and tertiary/postsecondary are degree-oriented.

Training involves teaching a person a particular skill, knowledge or type of behavior that is related to specific competencies.  Training has targeted goals of improving an individual’s capability, capacity, productivity and performance.  While some training programs are degree-oriented (such as technical colleges), most training programs (such as skills training, on-the-job training, occupational training, apprenticeships and internships) are certificate-oriented.

From a Jobenomics perspective, understanding the difference between education and training is fundamental to U.S. labor force development.  Education is foundational and generally measured by tenure.  Training is specific and measured by what one can do once completed.  Educational degree-oriented programs are measured in years and are usually expensive.  Training programs are often as short as weeks or months, and are relatively inexpensive.  For people seeking careers, degree-oriented programs are usually the best choice.  For the underprivileged, unskilled and poorly educated segment of society, certificate-oriented skills-based training provides the most effective way to getting a good job, the first step towards a meaningful career.

2016 State of the U.S. Labor Force

2016 State of the U.S. Labor Force

By: Chuck Vollmer

11 January 2016

Download a copy of this report at:

 2016 U.S. Labor Force State-of-the-Union 11 Jan 2015

Executive Summary.  To get a true picture of the 2016 state of the U.S. labor force, one must examine all three labor force categories reported by the U.S. Bureau of Labor Statistics (Employed, Unemployed and Not-in-Labor-Force) as opposed to focusing on the “official” Unemployed rate known as the U3 rate, which represents only 2% of the U.S. population or 5% of the U.S. civilian labor force.  While Americans should be pleased that the U3 rate has dropped from its post Great Recession 10% peak to 5% today, America should concentrate on the combined non-working Not-in-Labor-Force and total unemployed (U6) population that encompasses 34% of the U.S. population.

US Labor Force Trends 2000 to 2016


From January 2000 to January 2016, the number of citizens Employed rose by 11%, Not-in-Labor Force by 37% and U6 Unemployed by 57%.  Since the end of the Great Recession in 2010 through 2015, Unemployment dropped by 40% but voluntary workforce departures continued a steady exodus reaching a high watermark of 94 million able-bodied adults who choose not to work.  If this trend remains unabated, Jobenomics forecasts that America’s able-bodied, not-working population could equal its working population by the mid-2020s, or sooner if the United States slips into recession.

By not including the able-bodied, not-working population in State of the Union deliberations, policy-makers play a statistical shell game with American citizens who cannot be expected to comprehend the intricacies of labor force statistics.   Sooner or later, the American people will figure out that it is theoretically possible for the United States to have a zero rate of unemployment while simultaneously having zero people employed in the labor force.  The reason for this disquieting statement involves how government measures unemployment.  To be classified as unemployed, one must be looking for work.  Able-bodied Americans who quit looking and voluntarily depart the workforce are accounted in the Not-in-Labor-Force category—a category that is generally never mentioned in politics or the media.

While Americans should be pleased that employment is gradually increasing and the unemployment rolls are dropped significantly from Great Recession highs, they should be alarmed by exodus of tens of millions of able-bodied American adults to the netherworld of public/familial dependency and alternative lifestyles that harm economic growth and place greater burden on working and taxpaying Americans.

Jobenomics 2016 State of the Union’s Labor Force Assessment.[1]  As of 1 January 2016, out of a total U.S. population of 322,810,000[2], there are 70,874,000 citizens that cannot work (22% of the population consisting mainly of children, caretakers, retired, disabled, institutionalized and active duty members of the armed forces) and 251,936,000 citizens in the Civilian Noninstitutional Population (78% of the population consisting of all persons in the Civilian Labor Force and Not-in-Labor-Force categories that are 16 years of age and older and not inmates of mental or penal institutions or military active duty).

The Bureau of Labor Statistics (BLS) calculates the number of citizens in the Civilian Labor Force (persons classified as Employed or Unemployed) at 157,833,000 (49% of the U.S. population) and in the Not-in-Labor-Force citizens at 94,610,000 (29% of the population).

Within the Civilian Labor Force, the BLS reports on the total number Employed—currently 149,929,000 or 46% of the population—and six unemployment categories as shown below.  The most highly reported unemployment category is the U3 “Official” Unemployment category of 7,891,000 unemployed Americans (5.0% of the Civilian Labor Force or 2% of the overall population).  For this report, Jobenomics typically uses, for reasons explained herein, the U6 Unemployment category that consists of 15,625 000 citizens (9.9% of the Civilian Labor Force or 5% of the overall U.S. population).

URates


According to BLS, the basic concepts involving the U.S. labor force are relatively straightforward:

  • People with jobs are employed.
  • People are classified as unemployed if they do not have a job, have actively looked for work in the prior 4 weeks, and are currently available for work.  Marginally employed and underemployed personnel, who are actively looking for work, are reported as a subset of the Unemployed, and generally include part-time workers who work less than 35 hours per week.
  • Able-bodied adults who are neither Employed nor Unemployed are not in the labor force.  Those who have no job and are no longer looking for a job are accounted in the Not-in-Labor-Force category that includes people (over 16 years and older), or so-called “discouraged” workers, who choose not to work.

From a Jobenomics perspective, Not-in-Labor-Force personnel should be classified as unemployed in the same manner that marginalized and underemployed citizens are included in the U6 Unemployment category.  Determination whether a person is counted as unemployed should not depend on subjective, and often whimsical, survey questions used to appraise people’s employment intensions.

The four survey questions that government interviewers use to record a person as unemployed include (the bolded words are emphasized when read by the interviewers according to the BLS): [3]

  • Do you currently want a job, either full or part time?
  • What is the main reason you were not looking for work during the last 4 weeks?
  • Did you look for work at any time during the last 12 months?
  • Last week, could you have started a job if one had been offered?”

If a person answers yes to all four questions, that person is considered Unemployed.  If the answer is no to any of these questions, that person is enrolled in the Not-in-Labor-Force category.

Jobenomics’ 2016 State of the Union’s Labor Force Assessment.   To get accurate numbers in today’s labor force, Jobenomics uses a combination of Total Employed, U6 Unemployed and Not-in-Labor-Force obtained from the BLS Employment Situation Summary Report, Tables A-1 and B-1.

Jobenomics contends that able-bodied Americans who can work but don’t work, regardless if they are looking or not, should be considered unemployed for the same reason that “discouraged”, “marginally attached” and “part-time workers for economic reasons” are included in the U6 unemployment category.  The reason why the Not-in-Labor-Force and U6 categories should be examined collectively is for governmental transparency and accountability.  Sooner or later, the American public will figure out that it is theoretically possible for the United States to have a zero rate of unemployment while simultaneously having zero people employed in the labor force.  The reason for this disquieting statement involves how government measures unemployment.  To be classified as unemployed, one must be actively looking for work.  Able-bodied Americans who are no longer looking are accounted in the obscure, under-reported and arbitrary Not-in-Labor-Force category.  A combination of the two categories gives policy-makers and the public a truer picture of the “functionally” unemployed.

In terms of the President’s State of the Union Address on 12 January 2016 and the Republican response, it will be interesting to hear if the dialogue revolves around the U3 “official” unemployment rate and the rate of employment expansion during the post-recession recovery period.  From a Jobenomics perspective, resolving the Not-in-Labor-Force challenge is a much more important issue regarding the state of our union, the health of our economy and vitality of our labor force.

Year 2000 Through 2015 U.S. Labor Force Gains/Losses.  From the beginning of year 2000 through 2015, the net loss to the U.S. labor force totaled 18.7 million people.

Year 2000-2015 US Labor Force Gains Losses

Employment grew from 130.8 million to 143.2 million for a gain of 12.5 million workers.

During the same period, the combined cadre of unemployed and voluntary departures increased from 78.6 million to 109.7 million for a loss of 31.1 million potentially productive workers.

It is also important to note that the U.S. population grew by 40 million people since year 2000—a 15% increase from 2000 through 2015.  To understand the effect of population growth, one must look at the BLS’ Employment-to-Population Ratio that is at its lowest level in 30 years.  The Employment-to-Population Ratio would be much lower if not for working women who were not engaged in the U.S. labor force in the 1970s as they are today.  For more information on this, go to http://Jobenomics.com.

The principle source of employment growth since the beginning of this century has been in the private sector that created 11.0 million new jobs (88% growth or 5.5% growth rate per year)  followed by government that created 1.5 million new jobs (12% growth or 0.75% growth rate per year).

Within the private sector, the seven service-providing industries (professional and business services; education and health services; trade, transportation and utilities; financial activities; leisure and hospitality; information; and other services) produced 100% of the jobs growth during the period with 15.9 million new jobs, or growth rate of 1 million new jobs per year.  The three goods-producing industries (manufacturing, construction and mining/logging) lost 4.9 million jobs during the period.  Jobenomics forecasts that the goods-producing industries will not produce a significant amount of net new jobs in the foreseeable future regardless of amount attention it receives and political rhetoric.  For more information why, see http://Jobenomics.com.

Year 2010 Through 2015 U.S. Labor Force Gains/Losses.  From the beginning of year 2010 through 2015, the post Great Recession recovery period managed by the Obama Administration, generated a net gain of 13.8 million people in the U.S. labor force.

Year 2010-2015 US Labor Force Gains Losses

Employment grew from 129.7 million to 143.2 million for a gain of 13.6 million workers.  During the same period, the combined cadre of unemployed and voluntary departures remained virtually the same (110.0 million in year 2010 versus 109.7 million as of December 2015) with reductions of the number of unemployed being replaced by voluntary departures.

The principle source of employment growth year 2010 through 2015 has been in the private sector that created 14.0 million new jobs (13% growth or 2.2% growth rate per year)  followed by government that lost 0.5 million new jobs (a negative 2% growth or 0.37% growth rate per year).

Within the private sector, the seven service-providing industries produced 87% of the jobs growth during the period with 12.2 million new jobs, or growth rate of 2 million new jobs per year.  The three goods-producing industries also generated 1.9 million new jobs during the period, or 13% of the new jobs generated during the period.

Private sector service-providing industries and small businesses have been work horses of the economic recovery and principle sources of new jobs.  Today, private sector businesses employ 85% of the U.S. labor force, of which 100,590,000 Americans (70.9%) have service-providing jobs and 19,651,000 (13.7%) have goods-producing jobs.  As reported by the ADP National Employment Report[4], which surveys 400,000 U.S. businesses each month, small businesses created over 3.5 times as many jobs as big businesses in the last six years, 10.5 million versus 3.0 million respectively.

Over the last six years, the highly publicized “official” U3 unemployment rate was cut in half, from 10% to 5%, with a lot of fanfare.  Similarly, the “total” U6 unemployment rate fell by 43%, from 17.3% to 9.9%, with a reduction of 10.6 million people in the U6 category.   However, many of these formerly unemployed simply quit looking for work and were recounted in the BLS Not-in-Labor-Force category that grew by 10.3 million people, essentially wiping out the positive U6 gains.

From a policy-making perspective, the 94.1 million Americas who are no longer looking for work needs significantly more attention than the 15.6 million Americans who are still looking or are underemployed.   The current BLS Employment Situation Summary Report states that 95% of the Americans in today’s Not-in-Labor-Force “do not want a job now”.[5]   Why should they?  America provides generous welfare and means-adjusted programs that are not tied to workfare like the most generous European nations require.  Rather than hiring, U.S. corporations are preoccupied using profits on mergers and acquisition, expanding overseas and relocating corporate headquarters in foreign countries as a tax-saving measure.  Learning new skills to compete for 5.1 million open America jobs[6] takes lots of effort, making it much easier to drop out of the labor force, go on the dole and pursue alternative ways of living.

Year 2015 U.S. Labor Force Gains/Losses.  In 2015, the U.S. labor force suffered a net gain of 3.3 million.

Year 2015 US Labor Force Gains Losses

Employment grew from 140.6 million to 143.2 million workers for a gain of 2.7 million jobs, which was supplemented by a gain of 0.6 million in the combined U6/Not-in-Labor-Force cadre, which remained at relative the same level from the beginning of the year, 110.0 million to 109.7 million respectively.  While the U6 unemployment rolls decreased by 1.9 million people, 1.2 million people quit looking for work and voluntarily departed the U.S. labor force.  Private sector service-providing industries and small businesses continued to the dominant forces in labor force expansion producing 2.4 million (90%) and 1.9 million (70%) of the 2.7 new jobs created during the year.

From policy and economic growth perspectives, 2016 State of the Union deliberations should contain an order of magnitude more labor force programs oriented to service industry vitality, small business hiring incentives and small business creation than programs for big businesses and government jobs that are unlikely to create a meaningful number of new jobs.  In fact, big business is likely to downsize even further in 2016 consider the historically high number and value of corporate mergers and acquisitions, international pursuits and corporate inversions—all of which have negative consequences for U.S. labor force expansion and prosperity.  Small business expansion provides the most bang for the buck for strengthening the U.S. labor force and stemming the erosion of the American middle class.

[1] Labor force data in this document is taken from the latest U.S. Bureau of Labor Statistics (BLS) Employment Situation Summary Report unless otherwise footnoted.  The majority of BLS data used is from Table A-1, Household Data, http://www.bls.gov/news.release/empsit.t01.htm, and Table B-1, Establishment Data, http://www.bls.gov/webapps/legacy/cesbtab1.htm.

[2] U.S. Census Bureau, U.S. and World Population Clock, http://www.census.gov/popclock/

[3] BLS, Who is not in the labor force?, http://www.bls.gov/cps/cps_htgm.htm#nilf

[4] ADP Research Institute, National Employment Report, December 2015,  http://www.adpemploymentreport.com/

[5] BLS, Table A-38, Persons not in the labor force by desire and availability for work, age and sex,  retrieved 10 January 2016, http://www.bls.gov/web/empsit/cpseea38.htm

[6] BLS, Job Openings and Labor Turnover Report, Table 7, Job openings levels and rates by industry and region, retrieved 10 January 2016, http://www.bls.gov/news.release/jolts.t07.htm

Income Inequality versus Opportunity

PDF Version: Income Inequality versus Opportunity 26 November 2012

26 November 2012

There is a significant difference between income inequality and income opportunity.  Income inequality represents a rearward view on how much money a person possesses at a given time.  Income opportunity represents a forward view of wealth potential and upward social mobility.   Jobenomics recognizes income inequality as a starting point, but focuses on income opportunity, via business and job creation, especially at the base of America’s economic pyramid.

Income Inequality.  Income inequality is defined as unequal distribution of household or individual income across the various participants (regional, social, racial, gender) in an economy. Income inequality slows economic growth, reduces social mobility, causes financial conflicts and creates discord.  A survey for the World Economic Forum identified growing income inequality as one of the world’s most pressing issues for the next decade.  After a period of wane, income inequality is growing again in America.  US income inequality is often associated with income fairness and is now a dominant issue for policy-makers, media and social activists.

Much of the $6 billion dollars spent on the 2012 US election process focused on income inequality, especially rich (top 1%) versus middle-class and poor (the bottom 99%).  Inflammatory rhetoric and political attack ads offered few solutions but exacerbated our political divide. A recent New York Times article[1], entitled Look How Far We’ve Come Apart, addressed the severity of the political divide in our country.   Polarization between our two main political parties (shown below) has grown to the point of political paralysis.                                                                                                                                                                    

The article also indicates that the US public is similarly divided,
almost to the extent that America was divided prior to the American Civil
War.  The media are also polarized.  America has reached a crossroads where the left wing no longer believes anything the right as to say, and vice versa.  Now that the 2012 elections are history, the world is anxiously watching to see if America can reverse course and unite as a nation to address our strategic challenges. If we continue to focus on income inequality, America will continue to divide politically, socially and economically.  The word “inequality” is
divisive, implying inadequacy and disparity.  We cannot unify by using words, slogans and data that create dissension.

Conventional wisdom asserts (1) that income inequality is always bad, and (2) the United States is one of the most inequitable distributors of income on the planet.  Both of these assertions are not accurate.

Income inequality is not a condition that we should tolerate, but is a myth that it is always bad.  Throughout history, income inequality has been a powerful motivator.  The American Revolution had issues of income inequality at its roots.   Today, many of the greatest American success stories are about people from humble beginnings.  Some degree of income inequality can be tolerated as long as a corresponding degree of income opportunity exists.  Individuals and businesses would not innovate without the opportunity to reap rewards.  When opportunity exceeds inequality, people are generally optimistic and motivated to succeed.  However, when inequality exceeds opportunity, people are unhappy and motivated towards discordance.  Unfortunately, America has entered a period where inequality exceeds opportunity, which places the US economy at risk.

Regarding the assertion that America is inherently inequitable, let’s take a strategic view of income inequality using official US government data, which is footnoted for the reader.  Household income is generally used as the standard measure of income wealth by US government agencies.   US household income includes the income of the householder and all other individuals 15 years old and over in the household.  Household income is defined as income received on a regular basis not including capital gains or non-cash benefits (food stamps, health benefits, subsidized housing, and most other forms of welfare or entitlement benefits).  “Median” household income divides the total number of households and families (including those with no income) into two equal parts.

According to the US Census Bureau, 95.7% of US households (multiple incomes) make less than $200,000 and 49.8% make less than $50,000.  $50,000 represents the median US household income.  The US poverty line is approximately $15,000 depending on the number of people in the household.   These groups are usually defined as “middle-class” or “poor”.

The “the rich” are usually defined by personal income categorized in percentiles: top 5%, top 1%, and the ultra-rich.  To qualify for an entry level position in the top 5%, a person needs to earn an annual income of $150,000.  $340,000 is needed for the top 1%.  An ultra-rich person in the top 0.1% starts at $1.5 million.  An ultra-rich person in the top 0.01% starts at $8 million.

US median household income has fallen substantially this decade—the first such decline since the Great Depression in the 1930s.  The Median US Household Income chart, from the 2012 US Census Bureau report[2],  shows that median US household income started decreasing prior to the Great Recession.  In 2007, the median US household income for all races peaked at $54,489.  In 2011, it was $50,054, for a loss of $4,435, or 9%.  All races suffered a decline over the same period, but the US Asian community continues to have the highest median household income of $65,129, followed by Whites ($55,412), Hispanics ($38,624) and Blacks ($32,229).  Over the decades, income inequality has remained relatively the same between the races, collectively increasing during good times, and collectively decreasing over bad times.  During the good times, income inequality was not a politically-charged issue since increasing household income provided a sense of well-being.  During the last five years, declining household income has produced anxiety and discord.

The US Federal Reserve reports[3] on income inequality using the Income Gini Ratio (also called the Gini Index or Gini Coefficient) by race.  The Gini Ratio is defined as a measurement of income distribution that ranges from 0, representing perfect equality, to 1, representing prefect inequality.  As shown, Black Americans suffer the worse inequality within their own race.  In other words, the distance between rich and poor within the Black community is greater than the distance in other races.  The Hispanic community is the most homogeneous in terms of household income.  Whites and Asians are in the middle with the Asian community having volatile swings during the decade.

A number of international organizations, like the World Bank and International Monetary Fund, use the Gini Ratio to define income inequality among nations.  The Global Income Inequality chart (above) was created by Jobenomics using US Central Intelligence Agency data listed in their widely-accessed World Factbook’s Distribution of Family Income-Gini Index[4], which was compiled by the CIA using data from various international institutions.  As far as global income inequality, the United States ranks slightly above average.  The world’s worst income inequality is in emerging and totalitarian countries.  Industrial and democratic countries are much more equitable in terms of income inequity.  Globalization has narrowed the income inequality between nations but has exacerbated income inequality within nations due to global competition, international supply chains, global capital markets, and new information technology.

The data that gets most political and media attention is from the US Census Bureau’s Income Inequality Historical Tables[5].  The Census Bureau reports historical income inequality data in current dollars (not adjusted for inflation) and inflation adjusted dollars.

The US Historical Income Inequality chart was created by Jobenomics using Census 2011 dollars (adjusted for inflation) over the last 45 years.  Over the last 4 ½ decades, the bottom 95% of US households have not made significant income gains.  The top 5% average household income increased from $111,866 in 1967 (note: unadjusted 1967 household income for the top 5% was $19,000) to $186,000 in 2011 for a gain of 66%, or 1.5% per year— significant but certainly not great.  To get to great numbers, one must use top 1% or top 0.1% data that is addressed below.


 Here is the same chart showing current dollars that are not adjusted for inflation.   In current dollars the top 5% increased their average household income by 879% ($19,000 in 1967 to $186,000 in 2011) as opposed 66% ($111,866 in 1967 to $186,000 in 2011) using 2011 Dollars that were adjusted for inflation.  Jobenomics believes that inflation adjusted dollars give more of an apples-to-apples comparison, than non-adjusted current dollar comparisons.

Jobenomics created the Top 1% chart using the most recent bipartisan US Congressional Budget Office report[6], updated August 2012 (note: the US Census Bureau does not report on the top 1%).  The chart shows that the top 1% far exceeds all other taxpayer incomes.  In 2009 Dollars, the top 1% earned an average after-tax income of $886,700 down from $1,120,500 a year before the recession.  The CBO also reports that there are 1.1 million top 1% households out of a total of 117.6 million US households, and that their share of total after-tax income was 11.5%.  In other words, the top 1% represents 1% of all households and earns 11.5% of total US income.

There is no US government data that regularly reports on ultra-rich income.  However, much antidotal data is available.   The average CEO of the top US companies make $13 million per year, not counting stock options.  By some accounts, the top 25 hedge fund managers make as much as all the top S&P 500 CEOs.  These managers make billions, not millions, per year.  From a global perspective, while Americans consider millionaires and billionaires to be rich, there are many areas of the world where personal wealth is measured in billions and trillions.  In oil rich Arab nations, baby-sheikhs (20 year olds) are worth tens of billions of dollars and their fathers are trillionaires.

The 2012 presidential campaign debated the merits of increased taxation on the wealthiest American.  Using Congressional Budget Office data[7], if taxes were increased by 5% on the top 1%ers, as requested by President Obama, approximately $60,985 more would be paid by each of the 1.1 million 1%ers.  The net result would be approximately $69 billion dollars in new tax revenue, which is a relatively insignificant compared to $1 trillion annual deficit spending.  Since $69 billion is only 7% of $1 trillion, the other 93% would have to come from increased taxes on the middle-class or reductions in spending.  If taxes were increased all Americas in the top 20%, the net result would be $264 billion, or 25% of our annual spending deficit.   It should be noted that the lower end top 20%ers (81st to 90th percentile) do not feel that they are wealthy, especially if the average $131,700 household income is a dual income family (e.g., husband and wife) each earning $65,850.

Income Opportunity.  Income opportunity involves money that people can earn as opposed to money that they have.  The term opportunity implies favorable conditions or prospects in order to attain advancement or success.  Today, the American dream of upward mobility, fairness and optimism has been shaken in the wake of a Great Recession, chronically high unemployment and a stagnant economy.

Income opportunity is directly influenced by socio-economic mobility.  Socio-economic mobility is the movement of an individual or group from one income level to another.  Socio-economic mobility can be upward or downward.  In America, with a few exceptions, mass upward socio-economic mobility has been the general trend since the creation of the United States.  Most people that enter US workforce from high school or college move from initial lower paying jobs to higher paying careers.  Those that dropout of school or society are likely to entrench themselves in the lowest income quintile with much lower mobility.  While welfare and unemployment payments provide a safety net for those in the lowest quintile, these payments tend to trap these same individuals in low quintiles by eroding their socio-economic mobility.  The longer a person is out of the workforce, the harder it is for that person to get a meaningful job.  Socio-economic mobility is also influenced by education and social status.  A presentation by Assistant Treasury Secretary Jan Eberly at the 2012 Economic Measurement Seminar produced an insightful graphic on intergenerational socio-economic mobility[8]:

According to Sec. Eberly, higher education is critical for economic mobility.  Without a college degree, children born in the bottom income quintile have a 45% chance of remaining there as adults.  With a degree, they have a roughly equal chance of attaining each income quintile, which means an 80% chance of being in a higher income quintile than their parents.

While America has always been know as the “land of opportunity”, the Great Recession and chronically high unemployment has eroded socio-economic mobility for those at the base of America’s economic pyramid.  A 2012 study[9] by the Economic Mobility Project of the Pew Charitable Trusts states while “Eighty-four percent of Americans have higher family incomes than their parents did….Those born at the top and bottom of the income ladder are likely to stay there as adults.   More than 40 percent of Americans raised in the bottom quintile of the family income ladder remain stuck there as adults, and 70 percent remain below the middle”.

Jobenomics believes that high school dropout rates, especially in the inner cities, is symptomatic of a greater problem—the lack of income opportunity.  Jobenomics is working with local leaders in Detroit, Harlem, Atlanta, Washington DC and a number of smaller communities, all of whom say that high dropout rates are directly related to the lack of jobs.  Why graduate from school when meaningful opportunities are not available?   Jobenomics defines meaningful opportunities more in terms of careers as opposed to jobs.  To most young people, minimum wage jobs are not meaningful as compared to income opportunities derived from illicit employment or government welfare benefits.  Consequently, Jobenomics emphasizes community-based business generators in order to mass produce thousands of micro-businesses in the inner city.  Micro-businesses provide meaningful income opportunity.

Many Americans feel that Washington policy-makers can fix our problems.  Jobenomics disagrees for a number of reasons.  First, a stagnant economy as well as a deeply divided citizenry  makes political consensus-building difficult.  Second, the biggest challenges for improving income opportunity are beyond Washington’s reach.  Thirdly, global competition in the digital age levels the playing field for 6 billion other people around the world who want income opportunity and are often more motivated to strive to get it.  While Washington has an important support role, it is up to the private sector to create businesses and jobs.

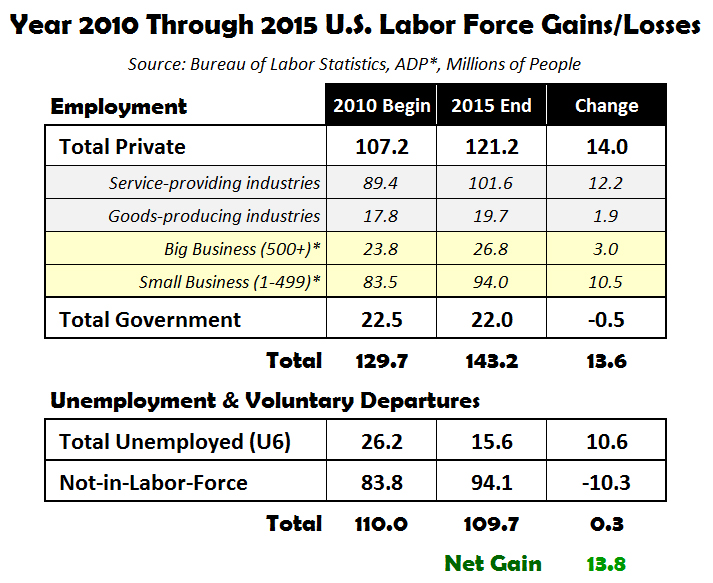
Since the beginning of this decade, small business has created 66% of all new jobs in America.

A recent McKinsey report[10] entitled Restarting the US Small-Business Growth Engine accurately describes small business as the engine of US economic growth with emphasis on “high growth” small businesses.  The McKinsey article states that “a subset of small businesses—high-growth ones—creates the vast majority of new jobs. Seventy-six percent of these high-growth firms are less than five years old. The 1 percent of all firms that are growing most quickly (fewer than 60,000 in all) account for 40 percent of economy-wide net new job creation.”   The biggest challenge for the McKinsey model is picking winners.  It is hard to identify the next generation serial entrepreneurs, like Bill Gates (Microsoft), Steve Case (AOL), Mark Zuckerberg (Facebook) and Meg Whitman (eBay). Therefore, the McKinsey model focuses on small businesses that already have established themselves with potentially high growth products or services. McKinsey also advocates big business and government assistance to help emerging businesses grow rapidly and mass produce jobs.

Jobenomics focuses on “highly scalable” start-up businesses that are unlikely to receive significant government and big business support.  Jobenomics is currently working on the establishment of a dozen community-based business generators that will mass produce small and self-employed businesses that can be replicated easily.  Self-employed businesses (both incorporated and unincorporated) are a good example of the type of highly scalable business that can be mass produced in order to create millions of jobs. The Jobenomics model focuses on individuals that have a yearning to start a business.  Jobenomics is currently concentrating on four demographics: inner city minority groups (service-providing businesses that focus on journeyman skill sets), women-owned businesses (direct-care, direct-sales and education/training businesses), Generation Y (start-up businesses that focus on monetizing social networks and the internet) and veterans-owned businesses (businesses that specialize in defense industry related occupations).  These demographics have the potential for 10s of millions of jobs and millions of new businesses that can be replicated across America.

In conclusion, income distribution is relatively well divided in the US even though a majority of Americans believe otherwise.  So why are Americans so upset about income inequality when official government data indicates otherwise?  For America to prosper, the answer lies with income opportunity, not income inequality.

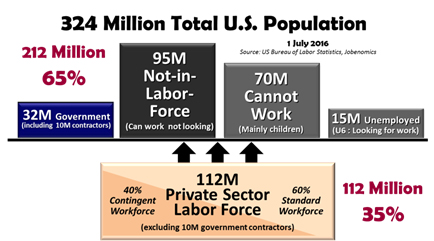
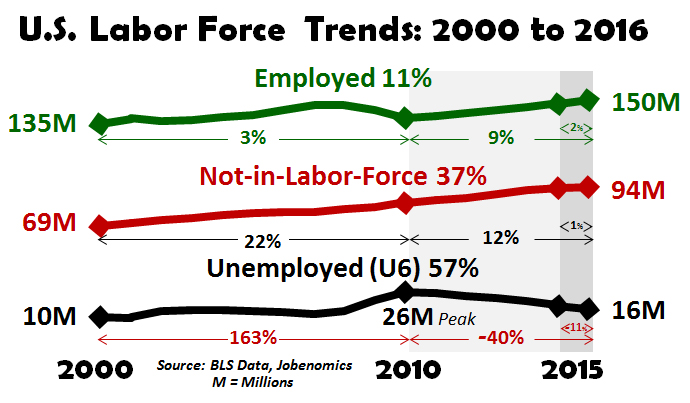
Today, too few are paying for too many.  Only 32% of our population financially supports the rest of our population.  We have a moral obligation to provide a safety net for the 23 million looking for work and the 70 million that cannot work.  We also have an economic imperative to grow the private sector work force that currently consists of 102 million people.  The Jobenomics goal is 20 million new private sector jobs by year 2020.  The Jobenomics national grassroots plan is designed to unite a divided nation through business and job creation with emphasis on small, emerging and self-employed businesses in the middle and bottom of America’s economic pyramid.  Providing meaningful income opportunity is essential to sustaining the American dream of mass upward social mobility.


[1] The New York Times, The Opinion Pages, Look How Far We’ve Come Apart, by Jonathan Haidt and Marc J. Hetherington, http://campaignstops.blogs.nytimes.com/2012/09/17/look-how-far-weve-come-apart/, 17 Sep 12

[2] US Census Bureau, Income, Poverty, and Health Insurance Coverage in the United States: 2011, by Carmen DeNavas-Walt, Bernadette D. Proctor and Jessica C. Smith, http://www.census.gov/prod/2012pubs/p60-243.pdf, issued September 2012

[3] US Federal Reserve Bank of St. Louis, http://research.stlouisfed.org/fred2/graph/?id=GINIBAF,GINIWANHF,GINIHARF

[4]  CIA World Factbook, Distribution of Family Income-Gini Index, https://www.cia.gov/library/publications/the-world-factbook/fields/2172.html

[5] US Census Bureau, Historical Income Tables: Income Inequality, H-1 All Races, http://www.census.gov/hhes/www/income/data/historical/inequality/

[6] Congressional Budget Office, Distribution of Household Income (Supplemental data spreadsheet), updated 10 August 2012, http://www.cbo.gov/publication/43373

[7] Ibid

[8] US Department of the Treasury, Remarks of Assistant Secretary Jan Eberly before the National Association of Business Economists (NABE), 2012 ECONOMIC MEASUREMENT SEMINAR, 31 July 2012,  http://www.treasury.gov/press-center/press-releases/Pages/tg1662.aspx, and http://www.treasury.gov/press-center/press-releases/Documents/View%20the%20charts%20shared%20with%20NABE%20today.pdf, Page 6

[9] Economic Mobility Project of the Pew Charitable Trusts, Pursuing the American Dream: Economic Mobility Across Generations, 9 July 2012, http://www.pewstates.org/research/reports/pursuing-the-american-dream-85899403228

[10] McKinsey & Company, McKinsey Quarterly, “Restarting the US small-business growth engine”, by John Horn and Darren Pleasance (Strategy Practice), November 2012, http://www.mckinseyquarterly.com/Strategy/Growth/Restarting_the_US_small_business_growth_engine_3032

Manufacturing Industry Forecast

Executive Summary:  US manufacturing is not likely to employ significantly more Americans than it currently employs.

Overview:  Manufacturing is a vital component of our economy.  Unfortunately, Americans have unrealistic expectations regarding the role of the manufacture sector in our economic recovery as well as jobs creation.  The American economy is dominated by service-providing industries that employ the 86% of all Americans. Manufacturing (part of the goods-producing sector) employs only 9%.  Correspondingly, American policy-makers and opinion-leaders do disservice to the American public by heralding manufacturing over other industries.  Reasonable rates of employment and economic recovery can only be achieved via a balanced approach to resourcing and supporting all growth industries.  Most Americans understand how we transitioned from an agriculturally-based society to an industrial-based society, but have not come to terms with the ramifications of a postindustrial, services-based, internet-empowered society that is significantly less dependent on domestic manufacturing.

Total US Employment.  Out of a total population of 314 million, America employs 133 million people in three sectors: service-providing industries, goods-producing industries, and government services.  115 million Americans (including government employees) are employed in service related jobs, which equates to 86.3% of all working Americans.  The service-providing sector employs 93 million Americans.  Government (federal, state, local) is the second largest employer at 21.9 million.  The goods-producing sector is the smallest with 18.3 million.  Manufacturing is the largest goods-producing industry that employs 11.97 million, which equates to 9% of all working Americans or 3.8% of our population.   At 9%, it is difficult to assert that the US is an industrial or manufacturing-based society.  With 86% in service related jobs, America is better defined now as a postindustrial, services-based country.

Recent US Manufacturing Employment Statistics.   US manufacturing employment decreased 39% from its pre-recession high.  If adjusted for population growth, the declination is 55%.  Over the last two years, manufacturing employment has increased 4% but is now trending downward.  Jobenomics predicts that the entire US manufacturing sector (durable and nondurable goods) will not produce significantly more jobs than it currently does. 

In 1946, 11.9 million Americans were employed in manufacturing.  By 1979, manufacturing grew to 19.5 million.  Then the decline began.  Over the last three and a half decades, manufacturing has declined 39% to 11.97 million today.  Since the post-Great Recession low in January 2010, manufacturing has grown by approximately 500,000 people.  This is good news, but insufficient evidence to believe that a manufacturing renaissance is underway.

The US manufacturing sector is comprised of durable and nondurable goods.  Durable goods consist of machinery, appliances or equipment that are not easily consumed or destroyed during use and lasts for over three years.  Nondurable goods are items, such as food and apparel that are used up quickly or purchased infrequently.

Durable goods have suffered a 39% decline from the peak in 1979 and now employ 7.5 million people or 63% of the total manufacturing sector.  From its post-recession low in January 2010, durable goods have added approximately 500,000 jobs or a gain of 7%.  Much of this gain can be attributed to generous federal government stimuli and bailouts (e.g., the auto industry).

There are 10 durable goods industries or subsectors as defined the US Department of Labor’s Bureau of Labor Statistics (BLS) as shown above.  The transportation/motor vehicles/equipment sector is the largest subsector with 1,468,000 employees.

The American public generally associates the automotive industry with this durable goods industry.  However, according to the BLS[1], the entire US automotive industry (both foreign and domestic manufactures) only employs only 772,000 people in motor vehicles and parts manufacturing, or 10% of the durable goods sector, or 6% of the manufacturing sector, or 1% of all working Americans, or 0.2% of all American citizens.  These percentages are offered not to diminish the importance of auto industry manufacturing, but rather to emphasize that there are a host of other industries and sectors that are equally critical to the American economy.

One could argue that the auto industry supports a vibrant retail trade (services-providing industry) with 1,716,500[2] Americans employed by motor vehicle and parts dealerships as well as another 815,000 independent automotive repair and maintenance personnel.  This is true.   Automotive manufacturing supports a large indirect jobs tail.  However, it is also true that US automotive manufactures are no longer the dominant vehicle provider in America.  In September 2012, out of a total of 1,188,865 light vehicle sales[3] made in America, only 44% (538,752 vehicles) were manufactured by American auto manufactures (GM, Ford and Chrysler).  Consequently, foreign automotive manufacturers now have a longer indirect jobs tail in the US than American auto manufacturers.  This large indirect tail of dealer and maintenance jobs would exist even if the Big 3 did not.  This is not meant to imply that the Big 3 and domestic manufacturing is not important.  It is vitally important.  The point is that automotive manufacturing, as well as other durable and nondurable goods manufacturers, may not be the job creators that most Americans expect.  Our limited resources should be invested in industries that have the most economic and jobs creation potential.

Nondurable goods have suffered a 38% decline from the peak in 1979 and now employ 4.5 million people or 37% of the total manufacturing sector. From its post-recession low in October 2010, nondurable goods have added an insignificant number of new jobs.

Coincidently, the largest nondurable goods industry, food manufacturing, employs exactly the same number of people (1,468,000) as the largest durable goods industry, transportation, and twice as much as the entire automotive manufacturing industry.  In addition, as shown above, food manufacturing was much more stable after the Great Recession and did not need stimuli, bailouts and buyouts from the US government and its taxpayers.

Industry Employment Growth.  As stated previously, manufacturing employs 9% of all working American’s, but how has it grown compared to other US industries?

Since the beginning of this decade (1 January 2010) with a growth rate of 10.5% over this 32 month period, the manufacturing sector is the fifth best jobs generator out of thirteen US sectors.  This is a welcome development after decades of steady decline.  Will this growth continue in the future?  Probably not.

The latest Manufacturing ISM Report on Business[4] data (depicted above) shows that US manufacturing contracted in two of the last three months.  This is the first contraction since June 2009 at the end of the Great Recession.  Since the Great Recession, US manufacturing trended upward, leveled and is now trending downward.  Note: the Manufacturing ISM Report index uses values over 50% as positive (expanding) and values under 50% as negative (contracting).

This downward trend follows general corporate trends like declining corporate earnings that are predicted to go negative in the first quarter of 2013[5] after positive growth in the eleven previously positive quarters (see posting entitled, Uncle Sugar High).  To a large extent corporate earnings and manufacturing recapitalization are inextricably linked.  Corporations are less likely to invest and hire with poor earnings.

In addition, the World Economic Forum (WEF)’s annual forecast[6] shows a rapid downward trend in American global competitiveness after being #1 for years.  The WEF is an independent international organization committed to improving the state of the world by engaging business, political, academic and other leaders.  Out of 144 countries, the WEF ranks the US #1 in market size, #6 innovation, #10 business sophistication, #8 higher education and training,  #23 goods market efficiency, #34 primary education, and #111 macroeconomic environment (i.e., low public trust in politicians and a perceived lack of government efficiency).  In 2006, the United Kingdom was #2, but disappeared thereafter.  Hopefully, the US will reverse the downward trend.  Competitiveness is paramount to success.

In the long-term, Jobenomics predicts that the manufacturing industry will not produce a significant number of new jobs for the following reasons:

  1. While the recent uptick in manufacturing jobs over the last few years has been slightly positive, the headwinds of the last three decades have not significantly abated.
  2. Emerging economies with lower labor rates, less regulations, better technical skills, and greater government underwriting will continue to be competitive in global manufacturing.
  3. US corporations will continue to outsource jobs to emerging economies despite government pressure and incentives to re-shore jobs. Many of the domestic job openings that require hi-tech skills will remain unfilled.
  4. The political ideological divide will prevent any meaningful pro-business policies, or significantly reduce the regulatory environment.
  5. The advent of the third industrial revolution has shifted the manufacturing equation from labor-intensive to technology-intensive and from jobs-heavy to jobs-lite with a premium on highly skilled labor as opposed to manual labor.

The American public generally understands the first four reasons even though they may be hard to accept.  Political rhetoric about streamlining the regulatory environment, increasing US exports, creating reciprocal trade agreements, imposing tariffs on cheaters, and lowering corporate taxes is good for elections but is not likely to be enacted nor achieved in the near future.  Free trade in a global marketplace will likely trump any attempts for protectionist legislation.  Mandatory entitlement programs will continue to drive government spending which is dependent on individual and corporate taxes.  In addition, corporations will, and must, continue to deliver profits to shareholders.  US multinational corporations will continue to expand overseas in emerging economies as opposed domestic expansion in the mature US market.   Finally, American workers, now the most productive workers in the world, will continue to produce more with less—requiring less labor per unit produced.

The third industrial revolution (reason #5) may be the biggest reason for a “jobs-lite” manufacturing future.  The first industrial revolution (IR1) took place in the late 18th Century with the mechanization of industry starting with the cotton gin.  IR1’s labor force consisted of high-touch, non-mass production, manual labor, which created the infamous sweat-shops in the 19th Century.  The second industrial revolution (IR2) started in the early 20th Century with the advent of Henry Ford’s moving assembly lines.  IR2’s labor force consisted of high-touch manual labor augmented by machinery designed for mass production.  The third industrial revolution (IR3) is currently underway.  IR3’s labor force consists of highly-skilled, hi-tech laborers who support digitally automated factories.  Each revolution has caused a reduction in low-skilled, high-touch jobs.

The third industrial revolution is powered recent technological advances including: artificial intelligence, high-speed broadband networks, robotics, web-based services, rapid prototyping (such as 3D computer-aided design and 3D printing), as well as innovative manufacturing processes that include better business process reengineering, global supply chain management, customer relationship management and enterprise risk management.   Consequently, most of the jobs will no longer be on the blue-collar factory floor but in white-collar offices.  Premium jobs will be for professional designers, engineers, logisticians, IT specialists and the like.  Old fashioned repetitive manual labor jobs are being eliminated or outsources overseas.  Traditional support staff jobs are also being eliminated or accomplished online.

In conclusion, manufacturing is vital to the US economy but is not likely to provide a significant amount of jobs to reach the Jobenomics goal of 20 million new jobs by year 2020.   20 million new jobs is a reasonable goal considering that the US produced 20 million new jobs in previous decades and that 20 million new jobs are needed for new workers (16 million per decade) and to decrease unemployment rates below 6% (4 million).  As such, it is imperative that the American public, policy-makers and opinion-leaders properly promote and support manufacturing in relation to the other twelve US employment sectors.  While major US durable goods manufacturers (such as automotive and aerospace) produce products that are a source of national pride, it is equally important to support less glamorous industries and businesses (especially small, emerging and self-employed) that are the engine of our economy and have the greatest jobs creation potential.


[1] Department of Labor’s Bureau of Labor Statistics, Automotive Industry: Employment, Earnings, and Hours, http://www.bls.gov/iag/tgs/iagauto.htm, July 2012

[2] Ibid.

[3] The Wall Street Journal, Auto Sales, Sales and Share of Total Market by Manufacturer,  http://online.wsj.com/mdc/public/page/2_3022-autosales.html, retrieved 3 Oct 2012

[4] Institute for Supply Management, Manufacturing ISM Report On Business , September 2012, http://www.ism.ws/ismreport/mfgrob.cfm

[5] The New York Times, Earnings in United States Are Beginning to Feel a Pinch, 16 September 2012, http://www.nytimes.com/2012/09/17/business/earnings-outlook-in-us-dims-as-global-economy-slows.html?nl=todaysheadlines&emc=edit_th_20120917

[6] World Economic Forum, Global Competitiveness Report 2012-13, http://www.weforum.org/issues/global-competitiveness