Jobenomics U.S. Unemployment Analysis: Q2 2016

Jobenomics U.S. Unemployment Analysis: Q2 2016

     By: Chuck Vollmer

Contact information: [email protected]

Download 50-page report at:

Jobenomics U.S. Unemployment Analysis - Q2 2016 - 6 August 2016

6 August 2016

Jobenomics reports on U.S. unemployment and employment size, characteristics and trends.   This Analysis focuses on how the U.S. government reports on unemployment and income statistics, why Americans who can work chose not to work, and the impact of 109.8 million non-working able-bodied citizens are having on the U.S. labor force and economy.   The Jobenomics Employment Analysis focuses on the U.S. labor force, business and job creation, and transformative trends—with emphasis on 60 million workers in the rapidly growing contingent workforce.

ToC Unemployment

Executive Summary

According to the U.S. Bureau of Labor Statistics (BLS), the U.S. labor force has three statistical categories: Employed, Unemployed and Not-in-Labor-Force.  Understanding the dynamics between these categories is required to understand the American labor force and ultimately the U.S. economy.

From an unemployment perspective, policy-makers, decision-leaders and the American public must address three major trends:  (1) growing voluntary workforce departures, (2) contingent workforce expansion, and (3) below average wage earner issues that are becoming more pervasive.

Sooner or later, the American public will figure out that it is theoretically possible for the United States to have a zero rate of unemployment while simultaneously having zero people employed in the labor force.  The reason for this disquieting statement involves how government measures unemployment.  To be classified as unemployed, one must be looking for work.  Able-bodied Americans who quit looking and voluntarily depart the workforce are classified in a nebulous and obscure Not-in-Labor-Force category that few people comprehend.

Six unemployment categories (U1 through U6) are reported monthly by the BLS.  Each category requires that an individual must be actively looking for work.  These categories are calculated as a percent of the Civilian Labor Force (Employed + Unemployed).  The BLS also calculates the number of able-bodied adults who can work, but are not looking for work, in a category entitled Not-in-Labor-Force, which is not part of the Civilian Labor Force (159 million), but part of the larger Civilian Noninstitutional Population (254 million), which is a subset of the entire U.S. population (324 million).

Working Versus Non-Working Populations

The latest BLS Employment Situation Summary[1] reports that 122.1 million Employed Americans work in the private sector[2] versus 109.8 million citizens who are Unemployed (U6, defined as total unemployed and underemployed people who are looking for work) and Not-in-Labor-Force (NiLF, defined as able-bodied adults who are capable of working but not looking for work for a variety of reasons).  From 1 January 2000 to 1 July 2016, the working population (Private Sector Employed) increased by 11% compared to a 40% rise in the non-working population (U6/NiLF).  The non-working population briefly exceeded the working population during the 2007-2009 Recession and is likely to outnumber the working population by 2024 if current trends exist, or earlier if an economic downturn occurs.

The U6 population includes the long-term unemployed (U1), job losers and temporary workers (U2), total unemployed workers (U3), discouraged workers (U4), marginally attached workers (U5) and underemployed workers who work part-time because they can’t find a full-time job.  It is important to remember that a person must be actively looking for work to be counted as unemployed in any of the six BLS unemployment categories.  In January 2000, the U6 population was 9,953,000.  The height of the Great Recession, U6 peaked at 26,440,000 April 2010, an increase of 166% since the turn of the Century.  Since peak through Q2 2016, the U6 dropped by 11.2 million people to 15,252,000 today.  Despite all the political fanfare, 15,252,000 unemployed, underemployed and marginally-attached citizens still represent 53% more people out of work than existed 16 years ago.

Able-bodied adults who are neither employed nor unemployed are not in the labor force.  Those who have no job and are no longer looking for a job are accounted by the BLS in the Not-in-Labor-Force category.  From 2000 through Q2 2016, the Not-in-Labor-Force cadre grew from 68,655,000 to 94,517,000, an increase of 26 million citizens who more often than not are dependent on public/familial assistance.

Since the post-recession April 2010 U6 peak in Q2 2010, the Not-in-Labor-Force cadre grew by 11.8 million, which offset the 11.2 million people that were no longer part of the U6 population. Today, the Not-in-Labor-Force exceeds the U6 Unemployed cadre by 6-times (94,517,000 versus 15,252,480) and 12-times the number of people enrolled in the U3 Unemployment category that is generally referred to as the “officially unemployed”.  This great disparity is rarely addressed by policy-makers, analyzed by decision-makers or mentioned by the media’s talking-heads, all of whom focus almost entirely on the “Official U3 Unemployment Rate” that is now at a post-recession low of 4.9%.

The ability to work should be the determining factor for unemployment as opposed to whether or not a person is looking for work.  Jobenomics contends that all able-bodied Americans who can work, regardless if they are looking or not, should be considered “functionally” unemployed.  Functional is defined as capable of working.  An able-bodied adult who is capable of working but chooses not to work should be considered unemployed for the same reason that “discouraged”, “marginally attached” and “part-time workers for economic reasons” are included in the U4, U5 and U6 Unemployment categories.

U3, U6, NiLF and Functional Unemployment

This chart shows U3, U6, NiLF and the Jobenomics Functionally Unemployed numbers in relation to the Civilian Labor Force.   The 4.9% U3 and 9.6% U6 are percentages of the Civilian Labor Force that consist of Employed and Unemployed workers who are currently employed or looking for work.

Hypothetically, if compared to the Civil Labor Force, the Not-in-Labor-Force cadre would equate to 59.5%, and the Jobenomics Functionally Unemployed (NiLF & U6) would be 69.1%, which gives one a sense of how large a challenge that the Not-in-Labor-Force cadre presents to the U.S. labor force and the American economy.

In order to achieve a sustainable economy and labor force, U.S. policy-makers and decision-leaders must shift their attention from an U3/U6 unemployment focus to understanding the reasons that able-bodied Americans who are capable of working are no longer looking for work and joining the ranks of those no longer in the U.S. labor force.  When as many people drop out of the labor force as enter it, the U.S. economy cannot grow as it should.

Most economists believe that economic growth depends on job and GDP growth.  The ideal rate for U.S. GDP growth is 2% to 3%.  For the United States, a mature economy, sustained GDP growth significantly over 3% tends to led to overheating and bubbles.  Anything below 2% is considered sclerotic growth and makes the economy vulnerable to financial downturns.  During the post-WWII recovery, U.S. GDP grew at an average rate of 3.5% which created tens of millions of new jobs each decade.  Since 2000, U.S. GDP averaged 1.76%.  During the post-recession recovery period to today, U.S. GDP averaged 2.0% but is now slowing significantly.  In Q1 2016, U.S. GDP grew by an abysmal 0.8%.  Q2 2016 is estimated to be not much better at 1.2%.  Consequently, the combined GDP rate for 2016 is only 1.0%—an alarmingly low rate of growth.[3]

As far as the future, many economists feel that a recession (two quarters below 0% GDP growth) is likely.  The United States averages 3 financial downturns and 1.7 recessions per decade over the last 7 decades.  This decade (2010s) has been recession-free largely due to government deficit spending, increasing money supply, low interest rates, stimulus packages, bailouts, buyouts and foreign investment.  Now that the era of easy money is coming to an end, an anemic U.S. economy will have to operate under its own steam.

The period of frail GDP growth from 2000, has dramatically impacted the American middle-class and the U.S. labor force that gained 13,395,000 workers but lost 25,862,000 through voluntarily departures.  To make matters worse, the U.S. population grew by 44 million citizens since year 2000, which places a greater burden on taxpaying workers.  For most American workers, real wages (purchasing power) have not increased for decades and are not projected to improve soon.

Another alarming trend involves the dramatic rise in the contingent workforce, which now stands at 60 million employed workers, or 40% of the Private Sector Labor Force.  The BLS defines the contingent workforce as the portion of the labor force that has “nonstandard work arrangements” or those without “permanent jobs with a traditional employer-employee relationship”.  The Jobenomics U.S. Contingent Workforce Challenge Report estimates that the contingent workforce could be the predominant source (over 50%) of employed U.S. labor by 2030, or sooner, depending on economic conditions and seven ongoing labor force trends.[4]

The contingent workforce is comprised of two general categories: core and non-core.  Core contingency workers include agency temps, direct-hire temps, on-call laborers and contract workers.  Core workers generally represent low wage earners that have nonstandard work arrangements out of necessity, often subjected to exploitation, and usually not entitled to traditional employer-provided retirement and health benefits.  The non-core category includes independent contractors, self-employed workers and standard part-time workers who work fewer than 35 hours per week.  Non-core workers generally seek nonstandard work agreements as a matter of choice.

Jobenomics views the non-core workforce as a positive economic force that will grow significantly via the emerging digital economy.  On the other hand, Jobenomics views the core contingency as a major labor force challenge as more and more citizens work for substandard wages, become frustrated, and seek alternative sources of income.  The contingent workforce is addressed in this analysis from a Not-in-Labor-Force perspective and discussed in detail from an overall employment perspective in the Jobenomics Employment Analysis.[5]

2014 U.S

Contingent work, low wages and the attractiveness of the U.S. welfare/means-adjusted earnings programs are fueling the rapid and increasing exodus of citizens from the U.S. labor force.  In 2014, 86% of all Americans (including workers with earnings, Not-in-Labor-Force and those that cannot work, such as children, caregivers, disabled, elderly, etc.) made below average income.  Out of a total of 160.1 million full-time and part-time American workers with earnings, 115.2 million workers (72%) make less than the U.S. mean (average) income of $54,964.

2014 U.S

As shown, the demographics with the greatest need and potential are women, minorities, new workforce entrants and the growing cadre of poor white males.  96% of new workforce entrants aged 15 to 24, 85% of Hispanics, 82% of Blacks, 80% of Females, 68% White Non-Hispanics, 65% of Males and 60% of Asians earn below average wage.  The good news is that both women-owned and minority-owned firms have been growing at rates far greater than the national average.

A major reason for Not-in-Labor-Force growth is due to the growing attractiveness of welfare and entitlement benefits.  The U.S. federal government funds 126 separate programs targeted at low income people.  State, county, and municipal governments offer additional welfare and public assistance programs.  Combined welfare benefits pay more than minimum wage jobs in 35 states—in many cases, significantly more.  35 U.S. states offer welfare packages (not including Medicaid) more generous than the most lavish and liberal European countries.  39 states pay welfare recipients more than the starting wage for a secretary and in 11 states more than the first year wage for a teacher.

Once a person becomes dependent on welfare, transition to workfare becomes difficult.   Loss of critical workforce skills increase proportionally to the length of time a person is not working.  Most of the 5 million open employment positions in the United States are due to a deficit of skills and the capability to perform effectively in a working environment.  Prolonged dependency generates anger, grievances, activism, violence and counter-cultural lifestyles.

In today’s consumption-based and market-driven society, there is never enough public or familial assistance to satisfy the financially disaffected.  Consequently, those who need additional income often turn to temporary jobs, barter, the underground economy as well as illicit lifestyles (gangs, drugs and crime) rather than legitimate forms of long-term employment.  Jobenomics contends that workfare is the only reasonable alternative to welfare.  The problem is how to motive and facilitate this transition.

The solution to growing America’s economy, healing the middle-class and strengthening the labor force involves putting the U.S. small business engine into over-drive.  Energizing existing businesses and creating new small and self-employed businesses could create 20 million net new jobs within a decade.  To this end, Jobenomics is working with a number of cities to implement Jobenomics Community-Based Business Generators to mass produce startup businesses.

JCBBG Concept

Jobenomics Community-Based Business Generators mass-produce startup businesses by: (1) working with community leaders to identify high-potential business owners and employees, (2) executing a due diligence process to identify potential high quality business leaders and employees, (3) training and certifying these leaders and employees in targeted occupations, (4) creating highly repeatable and highly scalable “turn-key” small and self-employed businesses, (5) establishing sources of startup funding, recurring funding and contracts to provide a consistent source of revenue for new businesses after incorporation, and (6) providing mentoring and back-office support services to extend the life span and profitability of businesses created by the Jobenomics Community-Based Business Generators.

JCBBG Process

Starting a notional pool of 10,000 candidates, Jobenomics will work with local civic organizations (churches, non-profits, sports teams, etc.) to identify and nominate the top 10% to 25% candidates, who they know, for the Jobenomics Community-Based Business Generator program.  This is the first stage of the due diligence process to separate the proverbial wheat from the chaff.  These nominees will then be subjected to standard aptitude and attitude tests in order to willow the list down to several hundred trainees who we believe that could become high-quality employees and business leaders.  Approximately 10% would undergo business school training and certification (goal is to startup a locally-owned business) and 90% some form of skills-based training and certification that would be needed in our new startup businesses.  If each startup employed 10 people, 20 to 30 new small businesses would be created.

While the overall goal is to mass-produce small businesses, the Jobenomics Community-Based Business Generator will help all people who enter the program to find meaningful employment.  Many of the initial candidates are likely to prefer working for existing companies rather than going through the Jobenomics process.  Anticipating this, Jobenomics will implement a “pipeline” to connect these individuals who have undergone some level of due diligence to companies that are hiring.  A common complaint that Jobenomics often hears from companies is that they have a very hard time finding good people who want to work and who have the right attitudes/aptitude for work.   Consequently, Jobenomics Community-Based Business Generators will utilize a nationally recognized pipeline system that has recently matched hundreds of thousands veterans with employers.

324 Million

 In summary, the U.S. economy cannot be sustained by only 35% of the population that is eroding in terms of size, wages and income potential.

The private sector labor force produces the majority of American jobs, goods, services and revenue needed to sustain economic growth.  112 million private sector workers support 32 million government workers and contractors, 95 million able-bodied people who can work but chose not to work, 70 million who cannot work and the 15 million unemployed and underemployed.  Of the 112 million employed Americans in the private sector, approximately 60% are standard full-time workers and 40% are part-time and independent continent workers.

If American policy-makers and decision-leaders are serious about revitalizing the eroding middle-class, they must address the growing voluntary workforce departures, contingent workforce and below mean income issues.  Jobenomics believes that the place to start is with demographics with the greatest need and potential (i.e., women, minorities, new workforce entrants and the growing cadre of poor white males).  Jobenomics suggests that the 2016 Presidential candidates, in both parties, should make solutions to these labor force issues their top priority.

[1] U.S. Bureau of Labor Statistics, Employment Situation Summary, http://www.bls.gov/news.release/empsit.nr0.htm

[2] Government workers pay taxes just like private sector workers.  However, government relies on tax revenue to pay salaries.  Hence, Jobenomics often uses private sector figures when discussing the relative strength of the U.S. labor force and the economy.

[3] U.S. Bureau of Economic Analysis,  Gross Domestic Product: Second Quarter 2016 (Advance Estimate)

Annual Update: 2013 through First Quarter 2016, 29 July 2016, http://www.bea.gov/newsreleases/national/gdp/gdpnewsrelease.htm

[4] http://jobenomicsblog.com/wp-content/uploads/2016/05/U.S.-Contingent-Workforce-Challenge-4-April-2016.pdf

[5] http://jobenomicsblog.com/jobenomics-u-s-employment-analysis-Q2-2016/

Jobenomics Community-Based Business Generators

 Jobenomics Community-Based Business Generators

www.Jobenomics.com

By: Chuck Vollmer

15 August 2016

Download PDF:

Jobenomics Community-Based Business Generators - 15 August 2016

The way that government and big business can plan, manage and support small business and job creation is via community-based business incubators, business accelerators and business generators.

Business incubators tend to focus high-tech, silver bullet innovations that have extraordinary growth and employment potential.   Business accelerators focus on expanding existing businesses in order to make them larger and more profitable.  The Jobenomics business generator concept involves mass-producing small and self-employed business with emphasis on lower-tech but plentiful service-providing businesses at the base of America’s economic pyramid.  Many cities have business incubators, usually located at or around universities or technology parks, and business accelerators that are associated with mezzanine financing institutions.  Jobenomics is working with cities and states to create business generators to mass-produce startup small and self-employed businesses.

JCBBG Concept

Jobenomics Community-Based Business Generators mass-produce startup businesses by: (1) working with community leaders to identify high-potential business owners and employees, (2) executing a due diligence process to identify potential high quality business leaders and employees, (3) training and certifying these leaders and employees in targeted occupations, (4) creating highly repeatable and highly scalable “turn-key” small and self-employed businesses, (5) establishing sources of startup funding, recurring funding and contracts to provide a consistent source of revenue for new businesses after incorporation, and (6) providing mentoring and back-office support services to extend the life span and profitability of businesses created by the Jobenomics Community-Based Business Generators.

The process starts by using community leaders to identify high potential job seekers.  Churches, non-profit institutions, schools, sports teams and veterans groups are a great source for identifying talent, desire and fortitude.  These organizations provide the first phase of the triage process by screening and assessing high performance people who are known to them. The second stage is accomplished during onboarding that involves Jobenomics screening and assessing.  The third stage uses aptitude and personality tests to determine potential career paths.

Once completed, candidates will be separated into a business leader group or a high potential employee group for training.  The leader group will undergo management and startup business training.  The employee group will undergo skills training based on the role that they will assume in the startup business (operational, technical, mechanical, financial, marketing, administrative, etc.).  After the training is completed and certifications awarded, the team will commence startup operations under the guidance and assistance of the Jobenomics Community-Based Business Generator team.  Jobenomics contends that Community-Based Business Generators could vastly improve the rate of startups and expanding businesses, and reduce the rate of contracting and closing businesses.

JCBBG Process

Starting with a notional pool of thousands of candidates, Jobenomics will work with local civic organizations (churches, non-profits, sports teams, etc.) to identify and nominate the top 30% to 50%, who they know, for the Jobenomics Community-Based Business Generator program.  This is the first stage of the due diligence process to separate the proverbial wheat from the chaff.

These nominees will then be subjected to standard aptitude and attitude tests in order to identify and assist those (1) those that should be sent other educational (GED and postsecondary) or training (vocational) centers for career development, (2) those that are qualified and suitable for immediate employment with existing companies, and (3) those that desire and have an aptitude for starting a small or self-employed business.  Jobenomics Community-Based Business Generator will help all people who enter the program to find meaningful employment and career paths.

Jobenomics envisions that 25% of the nominees would seek a traditional education and training path, 25% would be hired directly by existing business who are looking for quality workers, and 50% would seek a more independent and self-sufficient route offered by a small business startup or self-employment.

Of the 50% that choose the Jobenomics Community-Based Business Generator training and certification process, Jobenomics anticipates that approximately 25% will eventually implement a small business startup or incorporate as a self-employed business.  The 75% that undergoes but does complete Jobenomics Community-Based Business Generator process will be certified (with empirical data by professional testing and evaluation) as high-quality candidates for immediate employment or traditional education/vocational training.

Many of the initial candidates are likely to prefer working for existing companies rather than going through the Jobenomics process.  Anticipating this, Jobenomics will implement a “pipeline” to connect these individuals who have undergone some level of due diligence to companies that are hiring.  Consequently, the Jobenomics management team includes a nationally recognized leader who developed such a pipeline system that has matched 250,000 veterans with companies.  This system is ideally suited for matching Jobenomics candidates to local employment vacancies.

The overall objective is to mass-produce small and self-employed businesses, which makes the Jobenomics Community-Based Business Generator process unique as a traditional business and workforce development center.  Traditional workforce development processes focus on preparing potential workers for employment by existing businesses—usually large corporations.  For marginalized individuals at the base of the American economic pyramid (especially those in depressed urban and rural areas) the odds of employment at existing businesses are slim as evidenced by the long lines at traditional job fairs versus the low percentage of people hired.

The Jobenomics process focuses on preparing workers for starting a business, whether they actually start one or use the experience to be more competitive to get a job.  In today’s world, gainful employment is difficult and oriented to those that are currently employed, credentialed or high-skilled.  Conversely, a common complaint that Jobenomics often hears from companies is that they have a very hard time (1) finding good people who want to work, (2) who have the right attitudes and aptitude for work, and (3) who have workforce credentials, experience or related skills.

Every nominee that enters the Jobenomics process will setup a self-employed business, which can be incorporated in a matter of days, and undergo elementary business training.  The reason for setting up a small business is to make them more competitive in today’s job market.  Many employers prefer to “try before they buy”.  An incorporated self-employed individual can position themselves for subcontract or contingent work (1099) as a prelude to standard full-time work (W2).  Even if a self-employed individual never receives an income as a self-employed business, that individual can present themselves with credentials (Employer ID Number, website, business card and skills resume) that align with the business community.  In addition, Jobenomics will provide additional credentials regarding the individual’s workforce aptitude, skills and suitability tailored to the specific hiring opportunity.  Jobenomics credentialing, along with letters of recommendation from the nominees’ sponsoring organization, will greatly distinguish the individual from the masses of unemployed or new or returning workforce entrants.

Today, the United States does not have standardized national, state or local processes to create or mass-produce startup businesses.  The U.S. startup process is largely ad hoc.  By instituting a community-based (all jobs are local) standardized, repeatable and scalable process to mass-produce startup businesses, millions of new establishments could be created across America.  By being part of a small business team, team members will be motivated to grow the business in order to make it more profitable, which facilitates upward mobility, higher wages, better benefits, potential equity positions, and, perhaps most importantly, a sense of camaraderie and purpose.

Job creation is the number one issue facing U.S. in regard to economic growth, sustainment and prosperity.  Jobs do not create jobs, businesses do, especially small businesses that currently employ 80% of all Americans and created 80% of all new jobs since the end of the Great Recession.

Unfortunately, America is focused on big business and government employment solutions that have not been very effective growing the U.S. labor force.  In fact, the U.S. labor force is in a state of decline as evidenced by the eroding middle-class and the transformation from standard full-time to part-time and contingency workers.  With the next fifteen years, Jobenomics forecasts that the contingent workforce will replace traditional full-time workforce as the dominant force of labor in the United States—a trend that is largely unknown to policy-makers and the American public.

Jobenomics asserts that the four demographics with the highest need and growth potential include women, minorities, new workforce entrants, and the large cadre of financially distressed citizens who want to work or start a business.  These demographics are ideally suited for the accommodating the growing contingent workforce and attracting new labor force entrants that often do not share the same employment dream of older generations.

Jobenomics believes that new small, emerging and self-employed businesses could create 20 million new jobs within a decade, if properly incentivized and supported.   Notwithstanding filling the 5+ million open U.S. jobs positions, the emerging Energy Technology Revolution (ETR) and the Network Technology Revolution (NTR) could create 20 million net new American jobs within a decade given proper leadership and support.

Using the Jobenomics Community-Based Business Generator process of mass-producing highly repeatable and scalable “turn-key” small and self-employed businesses, America writ large could create tens of millions of jobs that would transform the U.S. labor force, middle-class and economy as well as providing hope and jobs for marginalized urban and rural American communities.


Jobenomics U.S. Employment Analysis: Q2 2016

Q2 Employment Cover Q2 Employment ToC

Jobenomics U.S. Employment Analysis: Q2 2016

By: Chuck Vollmer

31 July 2016

Download 100-page report at:

Jobenomics U.S. Employment Analysis - Q2 2016 - 31 July 2016

Jobenomics reports on U.S. employment and unemployment size, characteristics and trends.   This Employment Analysis focuses on the U.S. labor force, business and job creation, and transformative trends—with emphasis on the 60 million workers in the rapidly growing, and underreported, contingent workforce.  The companion Unemployment Analysis focuses on how the U.S. government reports on unemployment and income statistics, why Americans who can work chose not to work, and the impact of 109.8 million non-working able-bodied citizens are having on the United States.

Executive Summary

Q2 Employment Summary


Current U.S. employment and job gains/loss statistics since the beginning of the decade are shown above.  Between 1 January 2010 and 1 July 2016, the United States has created 14,401,000 new jobs with a net gain of 14,764,000 in the private sector and a net loss of 363,000 in government employment.  81.1% of all new jobs this decade were produced by four service-providing industries (Professional & Business Services; Education & Health Services; Trade, Transportation & Utilities; Leisure & Hospitality).  Manufacturing and Construction industries contributed 5.6% and 6.7%, respectively. 77.9% of all Americans are now employed by small businesses that created 77.7% of all new jobs this decade.  In June 2016, small businesses created 85.4% of all new jobs with micro-businesses (1-19 workers) employing 69% more Americans than all large corporations with over 1000 employees.

While these employment statistics are positive, they are offset by three trends that threaten economic growth and stability.  These disturbing trends include voluntary workforce departures, contingent workforce growth and sclerotic GDP growth.

  • Voluntary Workforce Departures. In Q2 2016, the U.S. labor force lost 593,000 more workers than it gained due to the exodus of frustrated job-seekers and able-bodied workers to welfare and alternative lifestyles. Since year 2000, 25,862,000 able-bodied workers departed versus 13,395,000 workers who joined the labor force for a net loss of 12,467,000 workers.  This net loss does not include the number of unemployed (2.1 million more people are unemployed in 2016 than 2000) or population growth (42 million additional Americans today compared to 2000).
  • Contingent Workforce Growth. Contingent workers are defined by the U.S. government as “non-standard” workers who work part-time by necessity (temps and day workers) or by choice (free lancers and self-employed). Today, the contingent workforce is approximately 60,000,000 employed Americans or 40% of the total employed workforce.  By 2030, this number will grow to 80,000,000 or 50% of the U.S. employed workforce—a trend that is largely unknown to U.S. policy-makers and the American public.
  • Sclerotic GDP Growth. Most economists believe that economic growth depends on job and GDP growth. The ideal rate for U.S. GDP growth is 2% to 3%.  Since 2000, U.S. GDP averaged a sclerotic 1.76%.  During the post-recession recovery period to today, U.S. GDP averaged only 2.0%.   In Q1 2016, U.S. GDP grew by an abysmal 0.8%.  Q2 2016 is estimated to be not much better at 1.2%.

Job creation is the number one issue facing U.S. in regard to economic growth, sustainment and prosperity.  Jobs do not create jobs, businesses do, especially small businesses.  Unfortunately, America is focused on big business and government employment solutions that have not been very effective growing the U.S. labor force.  In fact, the U.S. labor force is in a state of decline as evidenced by the eroding middle-class and the transformation from full-time to contingency workers.

324 Million

35% of all Americans financially support the rest of the country.   As of 1 July 2016, out of a U.S. population of 324 million, 112 million private sector workers support 32 million government workers and government contractors, 95 million able-bodied people who can work but chose not to work, 70 million who cannot work, and 15 million unemployed and underemployed.   The U.S. economy is not sustainable with only 35% supporting an overhead of 65%.  The growing contingent labor force, which consists of mostly lower paid wage earners, makes the overhead burden even more precarious.  More people with livable wages and greater discretionary income must be productively engaged in the private sector labor force for the U.S. economy to flourish.

Workforce Education/Training Challenge

Workforce Education/Training Challenge

www.Jobenomics.com

By: Chuck Vollmer

1 August 2016

Workforce Education vs Training An 11-page Workforce Education/Training Challenge White Paper is available at: Workforce Education versus Training Challenge 1 Aug 2016

Executive Summary.  The Father of American Education, Horace Mann, stated that “Education then, beyond all other devices of human origin, is the great equalizer of the conditions of men, the balance-wheel of the social machinery.”  While Jobenomics agrees, the educational paradigm required for yesteryear’s workforce development may not be appropriate for many in today’s workforce.  Today the U.S. labor force is increasingly characterized by income inequality, an eroding middle class and a growing contingent workforce that traditional degree-oriented educational programs have not been able to mitigate.  More skills-based training and certification programs are needed.

The bifurcation of American society into haves and have-nots, skilled and unskilled, and hopefuls and the hopeless is a major educational/training challenge.  To those at the top of the American economic pyramid, the old paradigm of “get a degree to get a job, get a better degree to get a better job” is more important than ever.  On the other side of the ledger, to those at the bottom of the economic pyramid, more workforce technical and social skills training are needed to stem the increasing exodus to welfare and alternative lifestyles.  For many at the bottom getting a postsecondary degree is a bridge too far.  Earning a high school degree no longer guarantees a livable wage or viable career.

Education is defined as the process of imparting or acquiring general knowledge, developing powers of reasoning and judgment, and generally of preparing intellectually for mature life.  Education generally involves learning theory.  In the United States, there are four levels of education: pre-primary, primary, secondary and tertiary.  Pre-primary education includes kindergarten, nursery schools, preschool programs and child/day care centers.  Primary refers to first through eighth grades.  Secondary usually refers to the last four years of high school (ninth through twelfth grade).  Tertiary, also called postsecondary, refers to academic pursuit undertaken after high school.  Primary and secondary education are compulsory (required by law), whereas pre-primary and postsecondary education is not.  Postsecondary undergraduate programs, generally include associate and bachelor (baccalaureate) programs.  Postsecondary post-baccalaureate pursuits generally include masters and doctorate programs.  Primary, secondary and tertiary/postsecondary are degree-oriented.

Training involves teaching a person a particular skill, knowledge or type of behavior that is related to specific competencies.  Training has targeted goals of improving an individual’s capability, capacity, productivity and performance.  While some training programs are degree-oriented (such as technical colleges), most training programs (such as skills training, on-the-job training, occupational training, apprenticeships and internships) are certificate-oriented.

From a Jobenomics perspective, understanding the difference between education and training is fundamental to U.S. labor force development.  Education is foundational and generally measured by tenure.  Training is specific and measured by what one can do once completed.  Educational degree-oriented programs are measured in years and are usually expensive.  Training programs are often as short as weeks or months, and are relatively inexpensive.  For people seeking careers, degree-oriented programs are usually the best choice.  For the underprivileged, unskilled and poorly educated segment of society, certificate-oriented skills-based training provides the most effective way to getting a good job, the first step towards a meaningful career.

Jobenomics City & State Initiatives

Jobenomics City & State Initiatives

www.Jobenomics.com

By: Chuck Vollmer

29 July 2016

Download 16-page white paper at

Jobenomics City State Initiatives 29 July 2016

Jobenomics is now working directly with community leaders to develop business and job creation initiatives to mass-produce small businesses and jobs.  Emphasis is placed on demographics with the greatest need and potential—women, minorities and youth.  Jobenomics New York City, Jobenomics Delaware and Jobenomics Baltimore City initiatives are underway with other city and state efforts in progress.

  • Jobenomics New York City’s employment goal is for 1,000,000 net new jobs by 2026 in the five boroughs of New York City.  Jobenomics New York City is led by a Harlem community leader who is also running for Mayor of New York City. [1]
  • Jobenomics Delaware’s employment goal is for 150,000 net new jobs by 2026 across the three counties and three major cities in Delaware.  Jobenomics Delaware is led by a Dover business executive who is running for Lt. Governor. [2]
  • Jobenomics Baltimore City’s employment goal is for 100,000 net new inner-city jobs by 2026. Jobenomics Baltimore City is currently being led by a Commissioner of the Governors Workforce Investment Committee and inner-city Baltimore community leader. [3]

These community leaders are working with other community, government and business leaders to develop detailed plans, with actionable milestones, for citizens who desire meaningful jobs or want to start a business.

PowerPoint presentations for Jobenomics New York City, Jobenomics Delaware and Jobenomics Baltimore City are available as footnoted.

[1] Jobenomics New York City presentation:  http://jobenomicsblog.com/jobenomics-new-york-city/

[2] Jobenomics Delaware presentation:  http://jobenomicsblog.com/jobenomics-delaware/

[3] Jobenomics Baltimore City presentation:  http://jobenomicsblog.com/jobenomics-baltimore-city/

Jobenomics Delaware

Jobenomics Delaware Initiative (JDI)

By: La Mar Gunn, Candidate for Lt. Governor

30 June 2016

Download presentation and white paper at:

Jobenomics Delaware Presentation - 23 June 2016

Jobenomics Delaware White Paper 30 June 2016

After ten years of effort, hundreds of meetings with policy-makers, thousands of meetings with business and community leaders and an outreach effort to over two million people, many Americans believe that the Jobenomics Plan for America is the most mature and comprehensive business and jobs creation plan in the United States.  Chuck Vollmer, author and founder of the Jobenomics national grassroots movement (http://Jobenomics.com/), has joined my campaign for Delaware Lt. Governor.

Together, we developed an actionable plan to create triple the current rate of new job creation to create 150,000 net new jobs in Delaware within the next ten years.

JDI Goal

While JDI addresses big business and government employment, its principal focus is on highly-scalable small and self-employed businesses that employ 80% of all Americans and have produced 80% of all new jobs this decade.   Specifically, JDI will focus on (1) women, minorities, new workforce entrants and other hopefuls with the highest need and growth potential, (2) mass-producing startup businesses via community-based business generators, (3) attracting new highly-scalable businesses to Delaware with emphasis on filling open job positions and exploiting emerging and  new employment opportunities, (4) forming alliances with countries, cities, corporations and entrepreneurs, and (5) identifying sources of investment in order to achieve the JDI business and job creation goal.

JDI Framework

The initial JDI notional framework includes nine job creation areas for depressed urban (with emphasis on Wilmington, Dover and Newark), rural (with emphasis on agriculture and aquaculture) and coastal communities.  JDI will focus on filling current open jobs and exploiting emerging opportunities in caring services, construction, urban mining, the energy technology revolution and the fast growing digital economy.  This notional framework will evolve as community stakeholders adopt new areas for development.

The solution to growing Delaware’s economy and labor force involves putting Delaware’s small business engine into over-drive.  Therefore, the JDI team will work with community leaders to implement community-based business generators (CBBGs) that will mass produce startups, extend the “life span” of fledgling firms and accelerate existing businesses by (1) working with community leaders to identify and train high potential small business owners and employees, (2) implementing highly repeatable and highly scalable “turnkey” businesses with emphasis on the service-providing industries, (3) establishing sources of startup funding, recurring funding and follow-on contractual work to provide a consistent source of revenue for new businesses after incorporation, and (4) providing ongoing mentoring and support services.

A 50-page JDI presentation is available at www.GunnForUS.com.  If interested in joining JDI or setting up a meet to discuss this initiative, contact me at (302) 218-640.

2016 State of the U.S. Labor Force

2016 State of the U.S. Labor Force

By: Chuck Vollmer

11 January 2016

Download a copy of this report at:

 2016 U.S. Labor Force State-of-the-Union 11 Jan 2015

Executive Summary.  To get a true picture of the 2016 state of the U.S. labor force, one must examine all three labor force categories reported by the U.S. Bureau of Labor Statistics (Employed, Unemployed and Not-in-Labor-Force) as opposed to focusing on the “official” Unemployed rate known as the U3 rate, which represents only 2% of the U.S. population or 5% of the U.S. civilian labor force.  While Americans should be pleased that the U3 rate has dropped from its post Great Recession 10% peak to 5% today, America should concentrate on the combined non-working Not-in-Labor-Force and total unemployed (U6) population that encompasses 34% of the U.S. population.

US Labor Force Trends 2000 to 2016


From January 2000 to January 2016, the number of citizens Employed rose by 11%, Not-in-Labor Force by 37% and U6 Unemployed by 57%.  Since the end of the Great Recession in 2010 through 2015, Unemployment dropped by 40% but voluntary workforce departures continued a steady exodus reaching a high watermark of 94 million able-bodied adults who choose not to work.  If this trend remains unabated, Jobenomics forecasts that America’s able-bodied, not-working population could equal its working population by the mid-2020s, or sooner if the United States slips into recession.

By not including the able-bodied, not-working population in State of the Union deliberations, policy-makers play a statistical shell game with American citizens who cannot be expected to comprehend the intricacies of labor force statistics.   Sooner or later, the American people will figure out that it is theoretically possible for the United States to have a zero rate of unemployment while simultaneously having zero people employed in the labor force.  The reason for this disquieting statement involves how government measures unemployment.  To be classified as unemployed, one must be looking for work.  Able-bodied Americans who quit looking and voluntarily depart the workforce are accounted in the Not-in-Labor-Force category—a category that is generally never mentioned in politics or the media.

While Americans should be pleased that employment is gradually increasing and the unemployment rolls are dropped significantly from Great Recession highs, they should be alarmed by exodus of tens of millions of able-bodied American adults to the netherworld of public/familial dependency and alternative lifestyles that harm economic growth and place greater burden on working and taxpaying Americans.

Jobenomics 2016 State of the Union’s Labor Force Assessment.[1]  As of 1 January 2016, out of a total U.S. population of 322,810,000[2], there are 70,874,000 citizens that cannot work (22% of the population consisting mainly of children, caretakers, retired, disabled, institutionalized and active duty members of the armed forces) and 251,936,000 citizens in the Civilian Noninstitutional Population (78% of the population consisting of all persons in the Civilian Labor Force and Not-in-Labor-Force categories that are 16 years of age and older and not inmates of mental or penal institutions or military active duty).

The Bureau of Labor Statistics (BLS) calculates the number of citizens in the Civilian Labor Force (persons classified as Employed or Unemployed) at 157,833,000 (49% of the U.S. population) and in the Not-in-Labor-Force citizens at 94,610,000 (29% of the population).

Within the Civilian Labor Force, the BLS reports on the total number Employed—currently 149,929,000 or 46% of the population—and six unemployment categories as shown below.  The most highly reported unemployment category is the U3 “Official” Unemployment category of 7,891,000 unemployed Americans (5.0% of the Civilian Labor Force or 2% of the overall population).  For this report, Jobenomics typically uses, for reasons explained herein, the U6 Unemployment category that consists of 15,625 000 citizens (9.9% of the Civilian Labor Force or 5% of the overall U.S. population).

URates


According to BLS, the basic concepts involving the U.S. labor force are relatively straightforward:

  • People with jobs are employed.
  • People are classified as unemployed if they do not have a job, have actively looked for work in the prior 4 weeks, and are currently available for work.  Marginally employed and underemployed personnel, who are actively looking for work, are reported as a subset of the Unemployed, and generally include part-time workers who work less than 35 hours per week.
  • Able-bodied adults who are neither Employed nor Unemployed are not in the labor force.  Those who have no job and are no longer looking for a job are accounted in the Not-in-Labor-Force category that includes people (over 16 years and older), or so-called “discouraged” workers, who choose not to work.

From a Jobenomics perspective, Not-in-Labor-Force personnel should be classified as unemployed in the same manner that marginalized and underemployed citizens are included in the U6 Unemployment category.  Determination whether a person is counted as unemployed should not depend on subjective, and often whimsical, survey questions used to appraise people’s employment intensions.

The four survey questions that government interviewers use to record a person as unemployed include (the bolded words are emphasized when read by the interviewers according to the BLS): [3]

  • Do you currently want a job, either full or part time?
  • What is the main reason you were not looking for work during the last 4 weeks?
  • Did you look for work at any time during the last 12 months?
  • Last week, could you have started a job if one had been offered?”

If a person answers yes to all four questions, that person is considered Unemployed.  If the answer is no to any of these questions, that person is enrolled in the Not-in-Labor-Force category.

Jobenomics’ 2016 State of the Union’s Labor Force Assessment.   To get accurate numbers in today’s labor force, Jobenomics uses a combination of Total Employed, U6 Unemployed and Not-in-Labor-Force obtained from the BLS Employment Situation Summary Report, Tables A-1 and B-1.

Jobenomics contends that able-bodied Americans who can work but don’t work, regardless if they are looking or not, should be considered unemployed for the same reason that “discouraged”, “marginally attached” and “part-time workers for economic reasons” are included in the U6 unemployment category.  The reason why the Not-in-Labor-Force and U6 categories should be examined collectively is for governmental transparency and accountability.  Sooner or later, the American public will figure out that it is theoretically possible for the United States to have a zero rate of unemployment while simultaneously having zero people employed in the labor force.  The reason for this disquieting statement involves how government measures unemployment.  To be classified as unemployed, one must be actively looking for work.  Able-bodied Americans who are no longer looking are accounted in the obscure, under-reported and arbitrary Not-in-Labor-Force category.  A combination of the two categories gives policy-makers and the public a truer picture of the “functionally” unemployed.

In terms of the President’s State of the Union Address on 12 January 2016 and the Republican response, it will be interesting to hear if the dialogue revolves around the U3 “official” unemployment rate and the rate of employment expansion during the post-recession recovery period.  From a Jobenomics perspective, resolving the Not-in-Labor-Force challenge is a much more important issue regarding the state of our union, the health of our economy and vitality of our labor force.

Year 2000 Through 2015 U.S. Labor Force Gains/Losses.  From the beginning of year 2000 through 2015, the net loss to the U.S. labor force totaled 18.7 million people.

Year 2000-2015 US Labor Force Gains Losses

Employment grew from 130.8 million to 143.2 million for a gain of 12.5 million workers.

During the same period, the combined cadre of unemployed and voluntary departures increased from 78.6 million to 109.7 million for a loss of 31.1 million potentially productive workers.

It is also important to note that the U.S. population grew by 40 million people since year 2000—a 15% increase from 2000 through 2015.  To understand the effect of population growth, one must look at the BLS’ Employment-to-Population Ratio that is at its lowest level in 30 years.  The Employment-to-Population Ratio would be much lower if not for working women who were not engaged in the U.S. labor force in the 1970s as they are today.  For more information on this, go to http://Jobenomics.com.

The principle source of employment growth since the beginning of this century has been in the private sector that created 11.0 million new jobs (88% growth or 5.5% growth rate per year)  followed by government that created 1.5 million new jobs (12% growth or 0.75% growth rate per year).

Within the private sector, the seven service-providing industries (professional and business services; education and health services; trade, transportation and utilities; financial activities; leisure and hospitality; information; and other services) produced 100% of the jobs growth during the period with 15.9 million new jobs, or growth rate of 1 million new jobs per year.  The three goods-producing industries (manufacturing, construction and mining/logging) lost 4.9 million jobs during the period.  Jobenomics forecasts that the goods-producing industries will not produce a significant amount of net new jobs in the foreseeable future regardless of amount attention it receives and political rhetoric.  For more information why, see http://Jobenomics.com.

Year 2010 Through 2015 U.S. Labor Force Gains/Losses.  From the beginning of year 2010 through 2015, the post Great Recession recovery period managed by the Obama Administration, generated a net gain of 13.8 million people in the U.S. labor force.

Year 2010-2015 US Labor Force Gains Losses

Employment grew from 129.7 million to 143.2 million for a gain of 13.6 million workers.  During the same period, the combined cadre of unemployed and voluntary departures remained virtually the same (110.0 million in year 2010 versus 109.7 million as of December 2015) with reductions of the number of unemployed being replaced by voluntary departures.

The principle source of employment growth year 2010 through 2015 has been in the private sector that created 14.0 million new jobs (13% growth or 2.2% growth rate per year)  followed by government that lost 0.5 million new jobs (a negative 2% growth or 0.37% growth rate per year).

Within the private sector, the seven service-providing industries produced 87% of the jobs growth during the period with 12.2 million new jobs, or growth rate of 2 million new jobs per year.  The three goods-producing industries also generated 1.9 million new jobs during the period, or 13% of the new jobs generated during the period.

Private sector service-providing industries and small businesses have been work horses of the economic recovery and principle sources of new jobs.  Today, private sector businesses employ 85% of the U.S. labor force, of which 100,590,000 Americans (70.9%) have service-providing jobs and 19,651,000 (13.7%) have goods-producing jobs.  As reported by the ADP National Employment Report[4], which surveys 400,000 U.S. businesses each month, small businesses created over 3.5 times as many jobs as big businesses in the last six years, 10.5 million versus 3.0 million respectively.

Over the last six years, the highly publicized “official” U3 unemployment rate was cut in half, from 10% to 5%, with a lot of fanfare.  Similarly, the “total” U6 unemployment rate fell by 43%, from 17.3% to 9.9%, with a reduction of 10.6 million people in the U6 category.   However, many of these formerly unemployed simply quit looking for work and were recounted in the BLS Not-in-Labor-Force category that grew by 10.3 million people, essentially wiping out the positive U6 gains.

From a policy-making perspective, the 94.1 million Americas who are no longer looking for work needs significantly more attention than the 15.6 million Americans who are still looking or are underemployed.   The current BLS Employment Situation Summary Report states that 95% of the Americans in today’s Not-in-Labor-Force “do not want a job now”.[5]   Why should they?  America provides generous welfare and means-adjusted programs that are not tied to workfare like the most generous European nations require.  Rather than hiring, U.S. corporations are preoccupied using profits on mergers and acquisition, expanding overseas and relocating corporate headquarters in foreign countries as a tax-saving measure.  Learning new skills to compete for 5.1 million open America jobs[6] takes lots of effort, making it much easier to drop out of the labor force, go on the dole and pursue alternative ways of living.

Year 2015 U.S. Labor Force Gains/Losses.  In 2015, the U.S. labor force suffered a net gain of 3.3 million.

Year 2015 US Labor Force Gains Losses

Employment grew from 140.6 million to 143.2 million workers for a gain of 2.7 million jobs, which was supplemented by a gain of 0.6 million in the combined U6/Not-in-Labor-Force cadre, which remained at relative the same level from the beginning of the year, 110.0 million to 109.7 million respectively.  While the U6 unemployment rolls decreased by 1.9 million people, 1.2 million people quit looking for work and voluntarily departed the U.S. labor force.  Private sector service-providing industries and small businesses continued to the dominant forces in labor force expansion producing 2.4 million (90%) and 1.9 million (70%) of the 2.7 new jobs created during the year.

From policy and economic growth perspectives, 2016 State of the Union deliberations should contain an order of magnitude more labor force programs oriented to service industry vitality, small business hiring incentives and small business creation than programs for big businesses and government jobs that are unlikely to create a meaningful number of new jobs.  In fact, big business is likely to downsize even further in 2016 consider the historically high number and value of corporate mergers and acquisitions, international pursuits and corporate inversions—all of which have negative consequences for U.S. labor force expansion and prosperity.  Small business expansion provides the most bang for the buck for strengthening the U.S. labor force and stemming the erosion of the American middle class.

[1] Labor force data in this document is taken from the latest U.S. Bureau of Labor Statistics (BLS) Employment Situation Summary Report unless otherwise footnoted.  The majority of BLS data used is from Table A-1, Household Data, http://www.bls.gov/news.release/empsit.t01.htm, and Table B-1, Establishment Data, http://www.bls.gov/webapps/legacy/cesbtab1.htm.

[2] U.S. Census Bureau, U.S. and World Population Clock, http://www.census.gov/popclock/

[3] BLS, Who is not in the labor force?, http://www.bls.gov/cps/cps_htgm.htm#nilf

[4] ADP Research Institute, National Employment Report, December 2015,  http://www.adpemploymentreport.com/

[5] BLS, Table A-38, Persons not in the labor force by desire and availability for work, age and sex,  retrieved 10 January 2016, http://www.bls.gov/web/empsit/cpseea38.htm

[6] BLS, Job Openings and Labor Turnover Report, Table 7, Job openings levels and rates by industry and region, retrieved 10 January 2016, http://www.bls.gov/news.release/jolts.t07.htm

Jobenomics-New York City

Jobenomics launches New York City initiative to create 1 million net new jobs in New York City over the next decade. This initiative is lead by Rev, Michel Faulkner, a former New York Jets NFL player, who started the Institute for Leadership in Harlem to identify and train potential small business startups in association with Jobenomics. Michel Faulkner is also a candidate for Mayor of New York and a former candidate for the U.S. Congress. (Faulkner for NYC Mayor Website at www.faulknerfornewyork.com). The following white paper describes the Jobenomics-New York City initiative.

Michel Faulkner Jobenomics Cropped

Jobenomics-New York City

By: Rev. Michel J. Faulkner

Candidate for Mayor of New York City

17 November 2015

Download PDF version: Jobenomics New York City 19 November 2015.  Jobenomics New York City White Paper 19 November 2015.

Also see: Faulkner for NYC Mayor, http://www.faulknerfornewyork.com/.

After ten years of effort, hundreds of meetings with policy-makers, thousands of meetings with business and community leaders and an outreach effort to over two million people, many Americans believe that the Jobenomics Plan for America is the most mature and comprehensive business and jobs creation plan in the United States.  Charles D. (Chuck) Vollmer, author and founder of the Jobenomics national grassroots movement, has joined my campaign for mayor of New York City.  Together, we are developing an actionable plan to create one million net new jobs in New York City within the next ten years via implementation of community-based business generators that will mass-produce tens of thousands of startup businesses.

Jobenomics deals with economics of business and job creation.  Jobenomics national grassroots movement’s goal is to facilitate an economic environment that will create 20 million net new U.S. middle-class jobs within a decade.  The movement has reached millions of people via its blog, reports, TV/radio, social media, lectures and word-of-mouth.

Research.  Jobenomics produces a series of comprehensive reports including quarterly employment and unemployment reports that address the U.S. labor force, business and economic conditions.  Jobenomics provides advice and timely data to policy-makers and decision-makers regarding business and job creation trends.

Focus Areas.  While Jobenomics addresses big business and government employment, its principal focus is on highly-scalable small and self-employed businesses that employ 80% of all Americans and have produced 80% of all new jobs this decade.  Women, minorities, new workforce entrants and the growing cadre of poor white males represent future business owners with the highest need and growth potential.

National-Level Initiatives.  Jobenomics is leading two national-level initiatives called the Energy Technology Revolution (ETR) and the Network Technology Revolution (NTR).  These initiatives could create 20 million net new American jobs within a decade.  The ETR plan addresses emerging technologies, processes, systems and services across the entire energy spectrum for electrical power generation, transportation, storage and energy-related services.  The NTR is characterized by a “perfect storm” of advanced technologies including: cloud computing, semantic webs, ubiquitous computing, advanced networks, machine learning, robotics, credentialing, Internet-of-Things and artificial intelligence agents.   The NTR plan addresses America’s transition from a traditional to a digital economy and the transformational impact that the NTR will have on the economy, institutions, businesses and the labor force.

J-NYC Plan 1 Million Net New Jobs By 2026

Jobenomics New York City (J-NYC):  The J-NYC team is currently operating out of the Institute for Leadership facilities in Harlem (http://www.institute4leadership.com/).  The initial draft of the J-NYC plan will be completed by mid-2016, depending on ongoing consensus building activities and community participation, and will be a “living” document with actionable and measurable milestones built on the framework of Jobenomics Plan for America. The J-NYC plan focuses on (1) NYC demographics with the greatest need and potential, (2) mass-producing startup businesses via community-based business generators, (3) attracting new highly-scalable businesses to NYC with emphasis on the network-centric and e-commerce firms, (4) forming alliances with countries, cities, corporations and entrepreneurs and (5) identifying sources of investment in order to achieve the one million net new jobs goal.

The J-NYC Business and Job Creation Plan’s objective is to quadruple the historical rate of NYC new job creation (232,000 per decade) with a goal of one million net new livable wage jobs by 2026.   The plan concentrates on (1) implementing community-based business generators throughout the NYC metropolitan area, (2) developing workforce skillsets to fill vacant NYC jobs, (3) exploiting employment opportunities with the largest and fastest growing NYC industries, (4) implementing new business and job creation initiatives tailored to the needs of New Yorkers and (5) positioning the NYC labor force for substantial opportunities generated by energy and network technology revolutions.

J-NYC Community-Based Business Generator (J-CBBG) Concept.  The solution to growing the NYC economy and labor force involves putting NYC’s small business engine into over-drive.  Therefore, the J-NYC team will work with borough leaders to implement community-based business generators that will mass produce startups, extend the “life span” of fledgling firms and accelerate existing businesses.   J-CBBGs will (1) identify and train potential small business owners and employees, (2) implement highly repeatable and scalable businesses with emphasis on the service-providing industries, (3) establish sources of startup funding, recurring funding and contracts to provide a consistent source of revenue for new businesses and (4) provide ongoing mentoring and support services.

Filling Open NYC Job Vacancies.  As of November 2015, NYC’s five boroughs had 44,790 job vacancies.[1]  40,240 or 90% of the open positions are related to ten occupations: management, computer services, business and financial, sales, office support, healthcare, entertainment, social services, transportation and food services.  Corporations with the largest number of open vacancies were Capital One, JP Morgan Chase, Oracle, King Teleservices and Deloitte with a total of 6,129 open positions. J-CBBGs will work with companies and occupational associations that have a vested interest in fulfilling these vacancies via training or certifying viable candidates with a specific skillset, or starting new businesses that can provide tailored services as subcontractors.  The J-CBBGs will work with selected non-profits, such as employment-related institutions and churches (three Harlem mega-churches with over 250,000 parishioners have already agreed to support the J-CBBG concept), to perform the initial candidate due diligence.  J-CBBGs will conduct further evaluations (Jobenomics and The Institute for Leadership already perform testing of this sort) to determine if candidates are ready for employment and capable of starting their own small business (self-employed, home-based, e-commerce, contractor, franchise, etc.).  J-CBBGs will also build teams of future employees and future startup owners to increase camaraderie, accountability and successful launches.

Largest and Fastest Growing NYC Sectors

Exploiting Employment Opportunities with the Largest and Fastest Growing NYC Sectors and Businesses.  When preparing a labor force for maximum employment, J-NYC will begin with the largest and fastest growing sectors. NYC employs 4,191,500 workers.  542,000 (13%) work for government and 3,648,900 (87%) for the private sector.   J-NYC’s business and job creation effort concentrates, but not exclusively, on private sector service-providing industries that are the largest (82%) employers of New Yorkers and the fastest growing segment (2.1%) of the major employment sectors.  While the goods-producing segment (manufacturing, construction, mining) are vitally important, J-NYC feels that there is sufficient attention already being given to this segment that has limit upside employment potential as compared to services.

Within the NYC service-providing sector, the largest and fast growing industries are: Education and Health Services (866 million employees, 2.5% growth in the last year);   Professional and Business Services (687M, 2.1% growth); Trade, Transportation and Utilities (631M, 1.4% growth); Financial Activities (459M, 1.9% growth); Leisure and Hospitality (427M, 3.2% growth) and Accommodation and Food Services (340M, 2.3% growth).[2]  As a result of this data, J-NYC will work with NYC-based associations and companies in each of these industries to determine the level of interest and support for the J-NYC plan and their desire to engage with J-CBBG sponsorship, employee training and business startups.   From our initial conversations with various corporate leaders, there is a keen interest in “feeder” facilities that can provide certified job candidates and independent contractors.  Many would prefer to subcontract than hire.

New J-NYC Business and Job Creation Initiatives.  J-NYC’s outreach program has already started identifying potential stakeholders for business and job creation initiatives for those struggling to make a livable wage.  Most stakeholders say that they are eager to support any viable workfare over welfare initiatives.   As the J-NYC plan matures new initiatives and programs will be added to the ones currently being pursued by J-NYC.  J-NYC’s top three job creation initiatives are The Leadership Training Program, Urban Mining and Direct Care Centers.

  • The Leadership Training Program is underway at the Institute for Leadership (IFL) and producing solid results. This program trains, empowers, and partners with leaders and organizations that are already in the community including church leaders, business executives, government officials, athletic coaches and others who function in positions of leadership.  The program also is working with leaders on health reform, financial management and entrepreneur training.  Perhaps, the greatest benefit of this program is that J-NYC has a solid base of community leaders willing and eager to support the maturing J-NYC plan.
  • Urban Mining involves monetized urban waste streams such as municipal solid waste (MSW), construction and demolition material, tires and electronic waste. Waste is comprised of organic and nonorganic materials that can be reclaimed as commodities.  J-NYC advocates a zero landfill/export policy and programs that convert waste into fertilizers, energy, biofuels and valuable raw materials.  Jobenomics created eCyclingUSA LLC (http://ecyclingusa.com/) to help communities reclaim high value metals from electronic waste and use profits (average $30 million per year) for jobs and business creation.  A typical eCyclingUSA plant can produce $30 million in profit and employ several hundred people.  J-NYC is currently pursuing efforts to locate multiple eCyclingNYC facilities throughout the NYC metro that will hire the disadvantaged and formerly incarcerated.
  • Direct Care Centers are oriented to training and starting home-based, self-employed businesses that provide in-home eldercare, healthcare and childcare services. Direct Care is ideal for struggling households run by women who are looking for work or supplemental income to support their families.  One of the biggest reasons that single mothers are struggling financially is due to the cost of childcare.  Direct Care centers can help free many single mothers to join the workforce by training and supervising other single mothers to care for a neighbor’s children for a fraction of the cost of other services.   Direct Care Centers can also provide personnel and contract workers to large organizations, like New Partners, a subsidiary of Visiting Nurse Service of New York.  The Direct Care Center concept is the next logical step in IFL’s health reform effort.

Energy Technology Revolution (ETR).  The ETR will create hundreds of millions of jobs globally and millions for cities, like NYC, that embrace transformative energy technologies, processes, systems and services.  Using Jobenomics’ comprehensive ETR report as a baseline, J-NYC is developing a strategy for the greater NYC metropolitan area in regards to the economic impact and employment potential of the ETR.  For electrical power generation, J-NYC will evaluate the impact and challenges of cleaner fossil fuels, renewables, grid-level systems, point-of-use systems, greenhouse gas emissions, power density, storage, next-generation technologies, and investment.  J-NYC also plans to form alliances with sister cities in California, Japan, China and Germany that are embracing their versions of the ETR.  For example, Tokyo’s metropolis is similar to NYC in terms of power density and energy issues.   Consequently, it would be prudent to take advantage of any Tokyo’s successful ETR pursuit that could fulfill a NYC energy need.  For example, Tokyo Gas plans to install 2,500,000 energy efficient miniature point-of-use natural gas fuel cells in homes and apartments for power and heat generation.  NYC can also learn from Germany’s Energiewende (German for energy transition) national initiative to transition Germany from fossil and nuclear fuels to renewable energy,  California’s 2030 goal of having 50% of its electrical generation from renewables, and China’s extensive research in next generation ETR technology.  In the transportation area, sister cities in these countries are leading the way in advanced vehicles, alternative fuels and advanced storage systems that could be applied to shaping the NYC energy ecosystem.  In energy services sector, energy efficiency, energy conservation, energy security and Energy-as-a-Service (EaaS) businesses are growing at phenomenal rates and fertile areas for employment and startups.  Over the last five years, the Institute for Leadership has participated in Jobenomics initiatives in the energy services sector including energy audits, weatherization and solar installation certification training.  As a result, the IFL team believes that Jobenomics ETR plan is solid and will provide an excellent baseline for the J-NYC ETR plan, consensus building and collaborative engagement.

Network Technology Revolution (NTR).  The NTR will create literally billions of new jobs globally as the digital economy takes root.  Today, in terms of e-commerce, the overall U.S. economy is 5% digital and growing at 20% per year.  The United Kingdom leads the world with a 12% digital economy followed by South Korea at 8% and China at 7%.  China’s strategy to become the world’s leading digital economy is as breathtaking as it is comprehensive.  China is attempting to replicate its manufacturing miracle of lifting 400 million people out of poverty in two decades by implementing a combined public/private e-commerce strategy to lift an equal amount of rural Chinese out of poverty by 2030.   Alibaba Group, a Chinese conglomerate that recently (2014) had the largest Wall Street IPO in history, is positioning itself to be a global e-commerce leader by financing the creation of 10 million new Chinese network-centric microbusinesses.  Other Chinese conglomerates and government institutions are pursuing similar efforts.   J-NYC plans to collaborate with countries and companies like these, as well as U.S. corporate giants like Amazon, Google, Apple and Microsoft to help NYC create businesses and jobs in the rapidly growing digital economy.  J-NYC is in the process of identifying hundreds of emerging companies that have the potential to create jobs and small businesses in the same way that Uber (cars for hire), AirBNB (rental accommodations) and WeWork (office space) has accomplished.  Founded in 2010, WeWork is now the fastest-growing consumer of office space in 15 “high IQ” cities and is one of the largest office space providers in NYC.  The NTR also has a very dark side.  According to recent studies, computer automation can eliminate as much as 47% of the U.S. labor force in the next two decades.   Automation has been replacing manual labor for years, but via the NTR cognitive skill jobs are increasing at risk.  If there is any doubt just ask Apple’s Siri, Amazon’s Echo or IBM’s Watson.   The J-NYC NTR plan will seek to mitigate potentially massive NYC labor force departures (due to automation or voluntary departures) by creating highly-scalable new jobs and businesses that can compete and prosper in the digital economy.  The J-NYC NTR team will also work with existing businesses to adapt and harness the power of new NTR technologies, processes, systems and services to compete and prosper more effectively.

Funding.  J-NYC will pursue various sources of funding.  The Institute for Leadership has an initial bank pledge of $20 million for micro-business loans up to $50,000 for each new J-NYC small business created.  Other potential sources of funding include government bonds, debt/equity financing, corporate sponsorships, crowd funding and impact investing.  Impact investing refers to investments made to organizations that generate a measurable, beneficial social impact.  Socially conscious investing has grown in popularity with family foundations, philanthropic organizations, endowments, pensions, hedge funds, mutual funds and other financial institutions like Blackrock and Bain Capital.  NYC has a plethora of “top 1%” organizations and philanthrocapitalists (philanthropists who see themselves as social investors) that could be encouraged to underwrite J-CBBGs for their service to the public good as well as their public relations value to their organizations.

Contact.  The J-NYC team is interested in community leaders that are interested in workforce and small business development as outlined herein.  Please contact me or the J-NYC team at 212.690.7748 and the address is 245 W. 135th Street, New York, NY 10030.

[1] New York State Department of Labor, Labor Statistics, 9 November 2015,  https://www.labor.ny.gov/stats/nyc/

[2] New York State Department of Labor, Current Employment Estimates, https://labor.ny.gov/stats/lscesmaj.shtm

Network Technology Revolution

NTR Cover 7 Nov 2014

Network Technology Revolution

www.Jobenomics.com

By: Chuck Vollmer

7 November 2014

Download PDF:  Network Technology Revolution -7 Nov 2014

The Network Technology Revolution (NTR) could produce tens of millions of net new US jobs.  On the other hand, a recent Oxford University study estimates that the NTR could eliminate tens of millions of US jobs due to computerization.  Jobenomics believes that both predictions are correct.  If so, we should maximize the former and mitigate the latter.   To do so, the US needs a strategic framework that is accepted and promulgated by the major NTR corporations, political decision-makers and leading opinion-leaders.

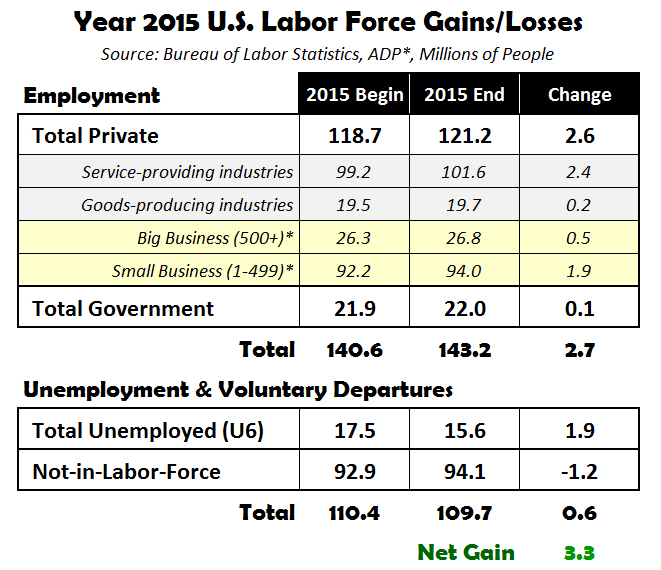
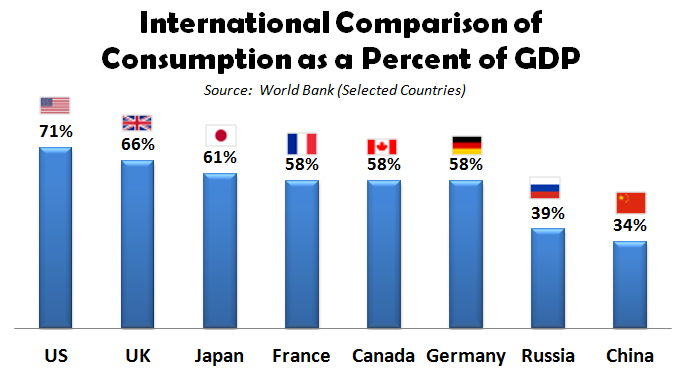
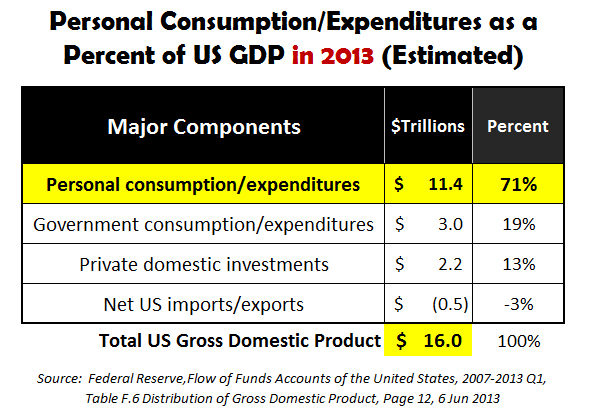
In order for the NTR to produce the maximum number of net new jobs, America needs a strategic framework that maximizes business creation and growth, while simultaneously mitigating business failures.   Unfortunately, this framework currently does not exist.  American decision-makers and opinion-leaders talk a lot about the importance of small businesses—the engine of the US economy— but their approach to small business creation is laisse faire.  Small businesses (<500 employees) employ 77% of all private sector Americans for a total of 91 million employees—almost 5 times the amount of large corporations (1000+ employees each).

If property orchestrated, the NTR could significantly boost business startups, as well as keeping them in business longer.  A recent Kauffman Foundation Study[1] finds that net job growth occurs in the US economy only through startup firms. The NTR could create millions of US small businesses if leading American NTR corporations focus on helping our tech-savvy generation monetize social networks and start NTR-related goods-producing and service-providing businesses.  Unfortunately, America’s current social media focus is more on entertainment than e-commerce.  While the former is nice-to-have, the latter is in the need-to-have category in order increase employment, build business, and grow the economy.

American companies are currently the NTR world leaders.  However, this is changing.  Chinese companies are rapidly assuming global NTR leadership.  Started in 1999 by Jack Ma, a former Chinese English teacher in Hangzhou, Alibaba’s rise has been historic and now is positioned to be the world’s leading NTR Company that specializes in consumer-to-consumer and business-to-consumer e-commerce.   Alibaba’s global leadership has been largely underwritten by Americans, starting with a major investment by Yahoo and recently by Wall Street’s largest initial public offering ever.  On its first day of trading on 20 September 2014, Alibaba easily surpassed CISCO and Facebook by market capitalization valuation of more than $231 billion, trailing only Google, Microsoft and Apple in value in the highly prized technology sector.

According to Jack Ma, Alibaba was founded[2] “to champion small businesses, in the belief that the Internet would level the playing field by enabling small enterprises to leverage innovation and technology to grow and compete more effectively in the domestic and global economies.” Alibaba’s vision to champion small business creation via the NTR will facilitate prosperity and full employment to a far greater extent than Google, Microsoft, CISCO, Facebook, IBM or Apple’s narrower product and services-oriented mission/value statements.  Ma’s strategic vision fits within China’s strategic framework to become the world’s leading economic power, which was accomplished just this year.

Gross Domestic Product Comparison

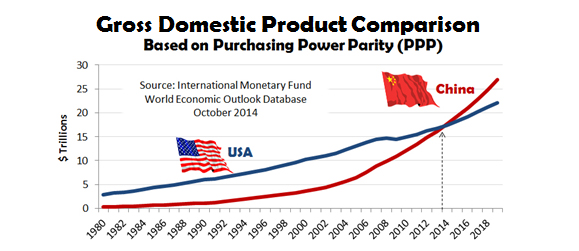
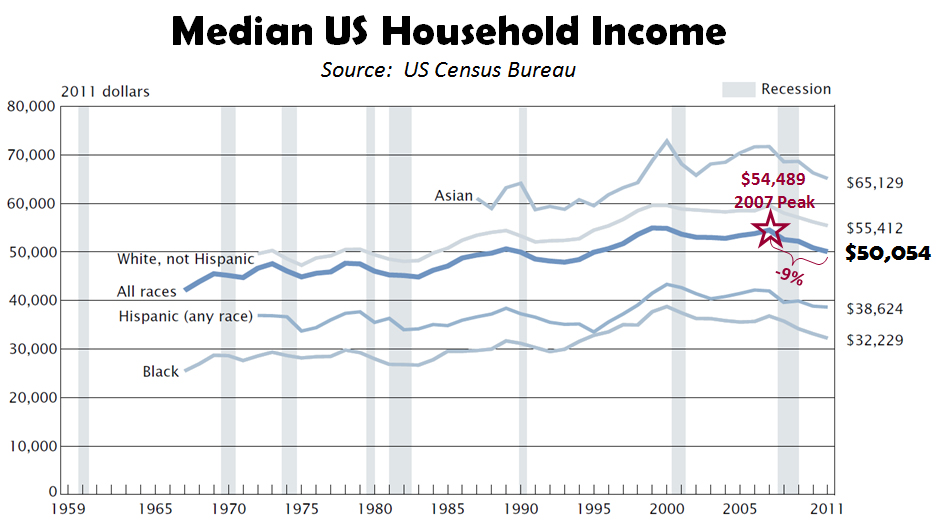
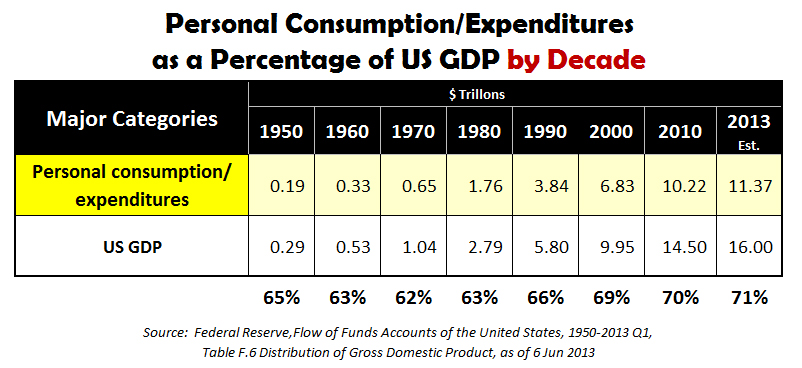
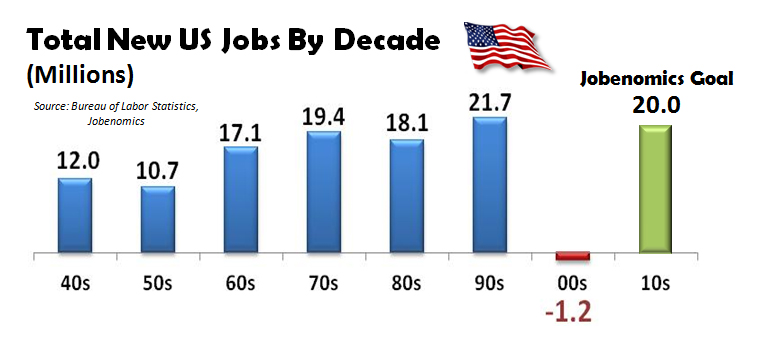
China has now overtaken the USA in GDP based on purchasing power parity (i.e., relative value of the US dollar compared to the Chinese yuan) to become the world’s most powerful economy.  Over the last two decades, the Chinese have been able to lift 200 million people from poverty into their work force, whereas in the same time period, 15 million more Americans departed the work force than entered it.   As the Chinese have proven, small business creation provides for income opportunity and wealth creation for the maximum amount of people in a society.

From a Jobenomics perspective, more American companies need to champion small businesses that would be enabled by NTR technologies, processes and procedures.  The NTR can raise all economies around the world.  It does not have to be a zero-sum game.

The Technologies

Technology Revolutions & the Enabling Technologies of the NTR.  In the 19th century, the Industrial Revolution (IR) transformed America from an agricultural-based society to an industrial-based society.  The Military Technology Revolution (MTR) was one of the deciding factors in winning the Cold War and underpinned the creation of the largest and most competitive economic superpower on the planet.  In the latter part of the 20th century, the Information Technology Revolution (ITR) ushered in a new era of prosperity and international commerce built largely on the Internet, which evolved from the US military’s ARPA-Net and creative genius of the co-founders of the personal computer, Bill Gates and Steve Jobs.  Today, the emerging Network Technology Revolution (NTR) has the potential to reshape the global economy.  Like the IR, MTR and ITR, the NTR could lead to the creation of tens of millions of new productive jobs, as well as countless economic and social benefits.

The Network Technology Revolution is defined by Jobenomics as the next generation in digital technology that will transform society and economies.  The NTR is characterized by a perfect storm of highly advanced technologies, processes and systems, including  big data (zettabytes of data stored in “clouds”), semantic webs (thinking websites), machine learning (systems that can learn from data), mobile robotics (automated machines capable of movement), ubiquitous computing (embedding microprocessors in everyday objects to communicate information without requiring human interaction), national broadband system (bringing high-speed networks to everyone ), and the “Internet of Things” (a world where more things are connected to the Internet than people).

Big Data is the term for a collection of data pools so large and so complex that it becomes difficult to process and access the data using traditional methods.  For most people who casually use the Internet, their digital world is expressed in terms of kilobytes (103) and megabytes (106).  For IT professionals, the digital world is now represented by zettabytes (1021).  The World Wide Web has now passed the zettabyte threshold, which is the estimated data storage required to record every written word in the history of mankind.   So what does the zetta-flood mean to America’s digital future?  Managing gargantuan levels of data is increasingly frustrating due to the complexities and costs of maintaining internal information technology environments.   By 2020, the number of data files is projected to grow as much as 75 times, compared to 1.5 times growth of the available pool of IT professionals.  As a result, organizations look to the promises of cloud computing to help solve issues related to ever-increasing amounts of big data.

Cloud Computing is as big a paradigm shift away from personal computers (PCs) as PCs were from mainframes in the 1990s. Cloud computing is the practice of using a network of remote servers hosted in data centers to store, manage, and process data, rather than a local server or personal computer.  To most people, cloud computing is as amorphous as its name suggests.  It is not hard to comprehend that most zetta-data will be stored in the “cloud” due to economies of scale and the decreasing cost of virtualized mega-servers in super data centers.  However, the “cloud” is much more than storage alone.  It also entails security, connectivity, portability, access, and other issues including privacy, legal and regulatory.

The Semantic Web enables machines to interpret “meaning” much in the way humans do.  In the beginning, the World Wide Web (WWW) consisted of non-semantic, read-only websites that focused only on data retrieval.   Today’s WWW 2.0 websites are semi-semantic, read-write websites that facilitate data sharing as evidenced by social media (Facebook, Twitter, etc.) and blogging.   WWW 3.0 will introduce fully semantic, read-write-execute websites.  WWW 3.0 browsers will perform functions for humans in merged virtual/physical worlds, and will act like personal assistants that learn the interests of users based on their previous activities, avatars that will represent the user’s alter ego in the virtual world, and virtually enhanced 3D worlds that will assist users in their physical world to educate, train, as well as entertain.   Technologies in the virtual world are advancing rapidly, especially in the realm of augmented reality (AR) where icons are overlaid (via holographic projections) on your real world view.  The US military’s AR awareness and visualization systems, and commercial systems, like Google Glass, will connect the semantic web to humans on the move, providing people with information tailored to their geo-located position and annotated with personalized items of interest via the “thinking” web.

Mobile Robotics involves automated machines capable of movement in multiple environments including factories (movable industrial robots), homes (automated cleaning devices and domestic entertainment robots), infrastructure (pipe and electrical conduit video inspections), surveillance (cameras and other detectors), land (unmanned ground vehicles), sea (autonomous water and underwater vehicles), and aerospace (unmanned aerial and space vehicles).  Mobile robotics is a major focus of current research in university, military and security, and medical environments.   Nanorobotic technology, which is largely in the research and development stage, will revolutionize medicine, with nanomachines and nanobots one billionth the size of a meter.  These devices could be used to attack cancer, dislodge clots and blockages, and perform surgery at the cellular level.   Mobile robotics is poised to make a major leap forward with the advent of atomic global positioning that replaces GPS satellites with highly accurate miniature devices that use atomic physics for positioning relative to the earth’s magnetic field.   This technology could equip systems with geo-location capability networked with the semantic web and the Internet of Things.

Ubiquitous Computing is also referred to as everywhere computing, pervasive computing and ambient intelligence.  Ubiquitous computing is an advanced computing concept that integrates computation into an environment via a myriad of embedded microprocessors in everyday objects (from clothes to animals to inanimate objects) that would be able to communicate information without requiring human interaction.  Ubiquitous computing represents the third wave of computing that evolved from the first generation mainframes (each shared by many people), to second generation personal computers (one computer, one person) and third generation ubiquitous computing (many devices communicating to one person).  The ultimate goal of ubiquitous computing is to make thinking things to interact with humans anywhere and everywhere.

Machine Learning involves a field of study that gives computers the ability to learn without constant human interaction.  Machine learning is a powerful artificial intelligence tool that can make sense of zettabytes of information.  For example, machine learning algorithms help email-providers identify spam, and cloud computing-providers eliminate malware.   Other applications include automating employee access control, reducing consumer wait times, predicting medical emergencies, self-driving cars and biometric recognition applications.  Machine learning and data mining have much in common, where the former is more predictive and the latter more discovery.  Data mining finds patterns for humans to understand and machine learning uses those patterns to improve its own program and understanding.

National Broadband.  Like electricity was to mankind in the 20th century, broadband will be in the  21st century.  National broadband systems will bring high-speed Internet connections to every home and business as part of a national digital infrastructure, which will make individuals and communities more competitive globally.  The next generation national digital infrastructure will likely feature a combination of fixed line and wireless broadband connections that will offer affordable, open-access data networks.  Currently, only 2/3 of all Americans have access to broadband.   The US National Broadband Plan envisions the fastest and most extensive wireless networks of any nation with affordable access for every American.  The plan will promote robust competition, reform antiquated standards, policies and laws and reallocate spectrum use, which is vitally important to mobile computing traffic (smart phones, pads and tablets) that is growing at a rate of 300% per year.

The Internet of Things/Everything will make many of the familiar devices and objects in our lives readily Internet-connected, smart phone-accessible and responsive in a world where more things are connected to the Internet than people.  The number of devices in the Internet of Things is projected to reach 50 billion by 2020, which equates to more than six devices for every person on earth.  To help access big data stored in clouds with billions of personal digital assistants, service providers are developing a myriad of NTR technologies, processes and systems.  Closely associated with the Internet of Things is The Internet of Everything.  Cisco defines the Internet of Everything as bringing together people, process, data, and things to make networked connections more relevant and valuable than ever before—turning information into actions that create new capabilities, richer experiences, and unprecedented economic opportunity for businesses, individuals and countries.

The Disruption

The NTR Will Be Both Brilliantly Innovative and Creatively Disruptive.  Brilliant innovation and creative disruption go hand-in-hand.  Brilliant innovation disrupts the status quo by producing something new, more efficient or more worthwhile. The technological combination of big data, cloud computing, semantic webs, mobile robotics, ubiquitous computing, machine learning, national broadband and the Internet of Things will disrupt, displace, or even destroy, existing markets, occupations and the labor force.  America is likely to be the first country to deal with NTR disruption since it has the dominant players and the largest free-market economy.

Disruptive Effects of Computerization to the Labor Force.  From an employment perspective, the NTR is likely to significantly disrupt the US labor force.   According to a recent Oxford University study on computerization[3] “about 47% of total US employment is at risk” over the next two decades.  Total US employment is 145 million.  If true, up to 69 million jobs could be at risk.

The Oxford University study on the effects of computerization on the American labor force is the first major effort to quantify what recent technological advances may mean for future US employment.  Their analysis was mainly from a technological point-of-view to determine what problems engineers need to solve for specific occupations to be automated.

US Occupations Subject to Computerization

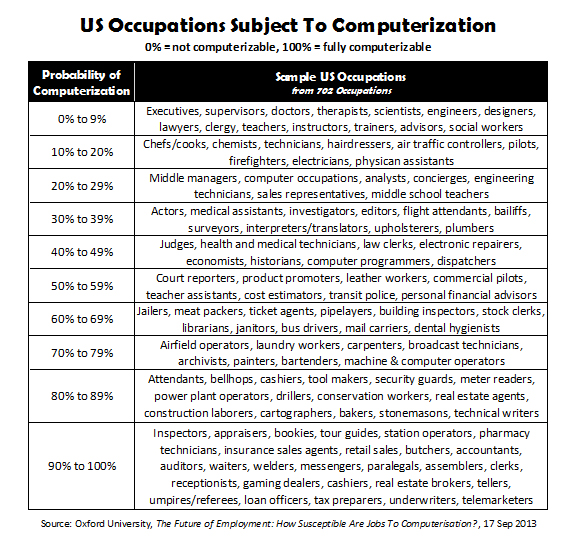
702 occupations from the US Department of Labor were analyzed.  The above chart was created by Jobenomics from the Oxford University data to show the probability of computerization of approximately 100 occupations arranged from 0% (not computerizable) to 100% fully computerizable.   The study acknowledges that sociological forces will likely restrict many of these jobs from actually being computerized.

Over the last hundred years, technological innovation initially had a destructive effect as technology substituted for labor but, eventually, as new industries and processes became more established, employment expanded along with wages.  Many believe that the NRT will be much different in a world of fierce international competition and America’s growing unskilled workforce.

Job Openings By Industry

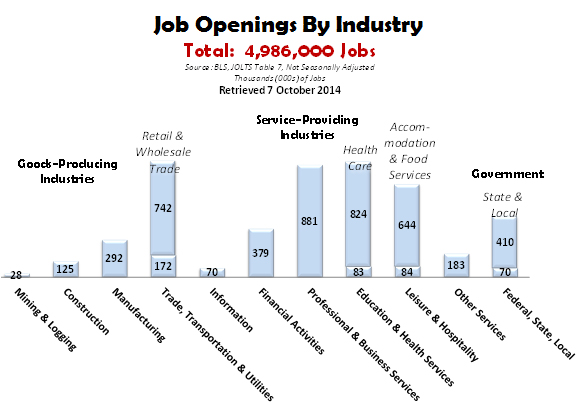
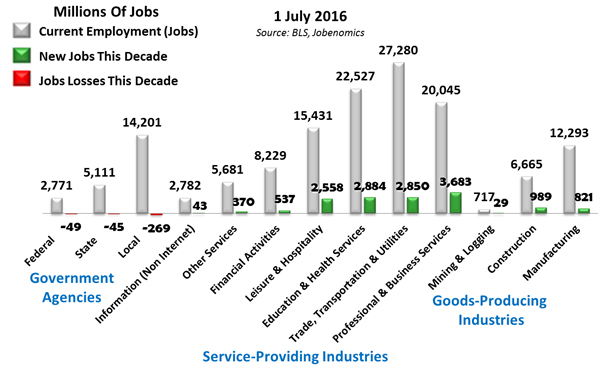
According to the most recent US Bureau of Labor Statistics (BLS) Job Openings and Labor Survey[4], there were approximately 5 million unfilled job openings. This survey includes estimates of the number and rate of job openings, hires, and separations for the nonfarm sector by industry and by geographic region.   As shown above, every major industry and government had job openings.  The primary reason for the large number of job openings is lack of job skills.   The lack of qualified workers will encourage increased emphasis on computerization of the workforce, elimination of jobs, and lower employment.

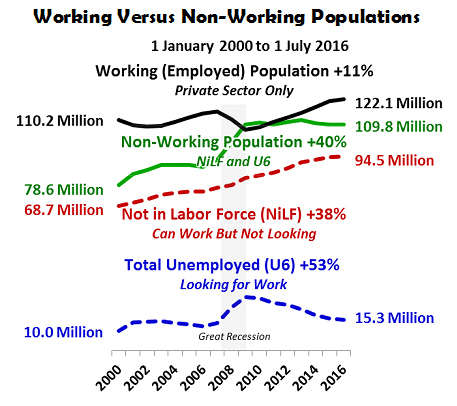
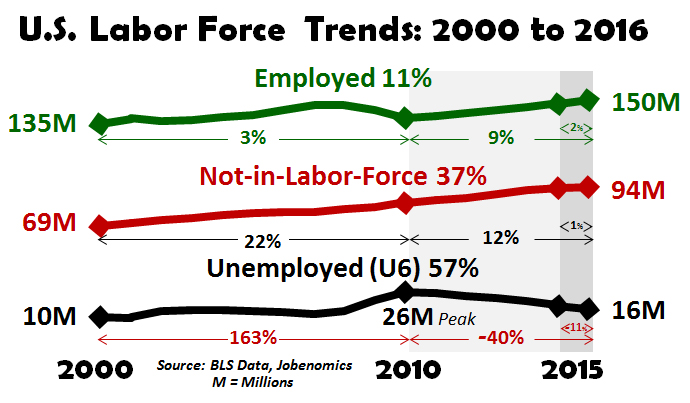
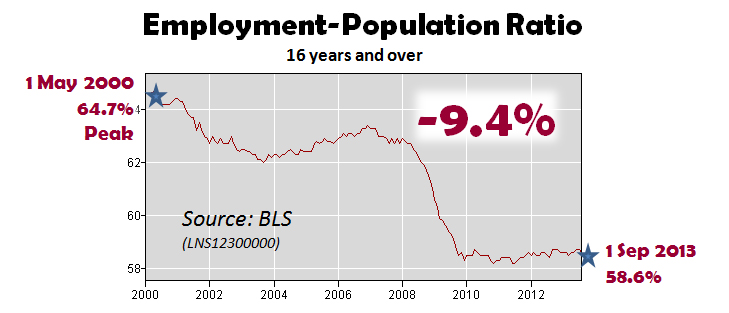
As John Maynard Keynes predicted in 1933, technological innovations pose the threat of economizing the labor force to the degree that it will outrun new uses for dislocated and unemployed laborers.   Jobenomics believes that the threat of technological innovation is now accelerating at a higher rate than ever before in US history.  Since year 2000, almost 3 times as many Americans departed the US labor force as entered it, with 8,657,000 people entering the US labor force as opposed to 23,929,000 who departed[5].  This is happening on both sides of the U-shaped skills level.  Greater and greater numbers of the under-educated and long-term unemployed are losing skills necessary to compete in the new labor force.  On the other side of the U-shape, college-educated graduates are finding that their degrees do not meet the needs of the labor market.  Unfortunately, American sociological and political forces are not helping.  Educational initiatives are not specific enough to adequately qualify new workers for the NTR marketplace.  The credo that education is the great equalizer may no longer be true if not focused.

The bottom line is that the NTR will be both brilliantly innovative and creatively destructive.  It would be tragic if the US-lead NTR produced millions of new jobs that are fulfilled overseas, thereby forcing many more Americans into unemployment or as wards of the state.  American decision-makers and opinion-leaders need to strategically plan to optimize the business and jobs creation capacity of the NTR and the important role that the NTR-providers have to play.   As discussed later, Jobenomics believes that this is very doable if the US implements a plan to mitigate losses incurred by NTR disruption by mass-producing small and self-employed businesses that are enabled by NTR technology, processes and systems.

Disruption of the Existing Marketplace Providers.   Handheld NTR devices (smart phones/pads/tablets connected to cloud-based data centers) are rapidly replacing personal computers and their related peripherals.  According to CISCO[6], in 2013, only 33% of total IP traffic originated with non-PC devices, but by 2018 the non-PC share of total IP traffic will grow to 57%.  PC-originated traffic will grow at a combined average growth rate of 10%, while TVs, tablets, smartphones, and machine-to-machine modules will have traffic growth rates of 35%, 74%, 64%, and 84%, respectively.  In addition, in 2013, wired devices (mostly PCs) accounted for 56% of IP traffic, but are forecast to decrease to 39% by 2018 as mobile computing devices become prevalent.

The ITR was dominated by goods-producing industries that sold hardware and software to consumers.   The NTR will be dominated by service-providing industries that will own and operate the hardware/software and will provide tailored services to consumers via subscriptions.  Personal digital devices cost hundreds of dollars versus thousands of dollars for personal computers and related peripherals.  The billions of dollars that are lost in personal computer sales should be offset by billions of dollars made in subscription services by cloud and content providers.  It is not inconceivable that competition will drive the cost of handheld devices to near zero as an incentive for long-term contracts for services, much in the same way telephone companies do today with cell phone services.

Worldwide IT Spending

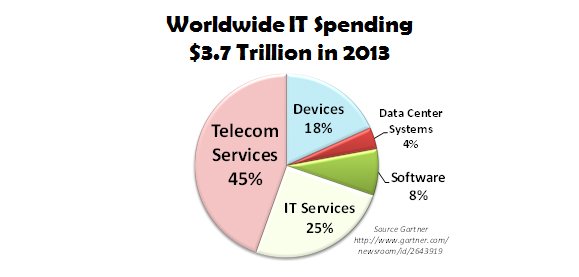
Gartner (a leading IT research and advisory company) forecasts that worldwide IT spending (telecom and IT services, devices, data center systems, software) will grow from $3.7 trillion today to $4.3 trillion in 2017[7].  Gartner breaks down the worldwide market into three segments: emerging (e.g., China), emerged (e.g., New Zealand) and mature (e.g., the US).  Emerging and emerged markets spend heavily on devices (mainly mobile phones) and telecom services (mainly mobile voice and data services).  Mature markets also spend heavily on devices and telecom services, but, compared to the emerging and emerged markets, are overwhelmingly investing on data center systems (servers, storage, and network equipment), software (enterprise and infrastructure), and IT services (business and IT product support).  Consequently, the US is likely to dominate the NTR in the near-future vis-à-vis their investment in core technology and systems (networks, data centers, cloud computing, machine learning, software, services, etc.) whereas most of the rest of the world is spending on NTR devices and subscription services.

In 2013, information technology market spending was 70% services-related and 30% goods-related (devices, data centers and software).   Jobenomics believes that services-providing industries will become even more dominant as the NTR matures.  Jobenomics also forecasts that subscription-based revenues will be preferable to consumers than sales of individual products and traditional service fees because the transition from the ITR to the NTR will be dynamic and complicated.  Consumers will likely be attracted to the NTR provider with the best brand who will manage the consumer’s network-centric architecture at the lowest cost.   For individual consumers, their network will largely consist of integrated personal devices (from smart phones, to PDAs, to entertainment devices) and their connectivity to highly reliable networks and content providers.   For government and corporate consumers, their net architecture will likely consist of a complex combination of public, private and hybrid enterprise-wide networks.  Today’s service providers are categorized as software, platform or infrastructure as a service (SaaS, PaaS, IaaS, respectively) providers.  The future NTR-service provider of choice will be the one that unifies all three categories, is able to strategically position and rapidly reposition their clients in a dynamic digital ecosystem, and offers the most integrated, secure, low-cost, and digitally portable subscription service.

The NTR will present huge revenue opportunities for collaborating NTR institutions.  Joint ventures, mergers and acquisition will be the norm as the NTR marketplace rationalizes itself into winners and losers.  Dominant NTR companies will have an initial advantage, but the field of exciting new NTR providers and vendors is growing exponentially.  NTR competition will be fierce between content providers, equipment manufacturers, software providers, social-networking giants, service providers, niche and emerging players.

Competition for new markets has just begun.  Relatively unknown new network-centric companies  are likely to displace today’s information service providers in the same way the information service providers replaced telecommunications companies that dominated the information marketplace twenty years ago.  In the last 18 months, over a dozen niche players have gone public, fetching tens of billions of dollars’ worth of investment capital.  If subscription services become the norm as forecast, content providers may emerge as dominant players in the NTR, especially considering the fact that video traffic (TV, video on demand, etc.) constitutes the majority of all consumer Internet traffic.   International competition cannot be understated.  US hegemony in the NTR marketplace could be upended as well-financed, foreign innovative solutions enter the competition for IP traffic (Internet Protocol where data is sent from one IP address to another).

Network Traffic by Region

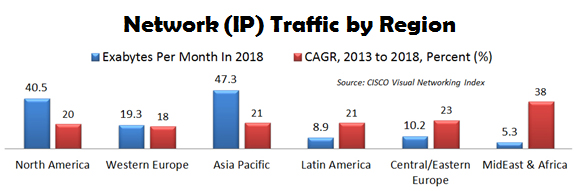
In terms of network IP traffic, North America will only consume 31% of the total traffic in 2018[8].  Asia Pacific will be the largest consumer and MidEast/Africa will be the fastest growing.   In Asia, China is the dominant player.   China is currently dominated by Alibaba that controls 90% of the consumer-to-consumer and 51% of the business-to-consumer e-commerce.  More importantly to international e-commerce, with the Chinese government’s permission, Alibaba locks out competitors (like Amazon) by allowing global consumers to only search Alibaba’s content from within Alibaba’s websites.  As Jack Ma says, “Today is cruel.  Tomorrow is crueler.  And the day after tomorrow is beautiful.”  International competition is likely to be as cruel as it is innovative.

Disruptiveness of Connectivity.   The NTR will be significantly more disruptive—technologically, economically and sociologically—than its ITR predecessor.  The ITR started in the 1960s with the first commercial uses of mainframe computers, followed by the Internet, personal computers, word processing, e-commerce, industrial robots, self-service technology, bar-code scanners, RFID sensors, personal digital assistants, and the like.   The 20th century ITR was more oriented to “sustaining innovation” that created tens of millions of net new jobs by evolving existing industries and introducing new industries with products that consumers wanted.  In contrast, the NTR is likely to be more oriented to “creative destruction” that will upend existing markets and value networks.

Soon everyone will be connected to every significant thing and person anywhere.  In contrast to the physical world, the virtual world frees us from physical limitations of birth, class and geography.  This sense of freedom empowers the individual over the organization, which makes state and institutional governance more problematic.   Consumers, activists and entrepreneurs will be able to create products and ideas that could challenge the status quo and usher in a new era of globalization based on new communities-of-interest and non-traditional ideas.

It is unclear if the freedom of movement through the virtual world and freedom of information in a relatively unstructured, unbounded ecosystem will be ordered or chaotic.  Innovation and new ideas generally originate from outside traditional institutional bulwarks.  Within a matter of a decade, five billion new minds, mostly from the developing world, will join the NTR.  Without doubt, their notion of fairness and equity will be far different from that of the developed world.  Depending on the scalability of new global initiatives or experiments, the consequences could be revolutionary as tens of millions join cause célèbres that challenge tradition.  Consequently, the NTR is likely to be more chaotic than ordered, and driven more by international rather than domestic consumers.

Disruptive Effects of Cybercrime & Cyberterrorism.  The NTR will usher in an era of cybercrime that could literally facilitate the largest negative transfer of wealth in history.  A landmark study conducted by CSIS and McAfee[9] estimates that the annual cost of global cybercrime is between $300 billion and $1 trillion with more than half this amount focused on four major countries: United States, China, Japan and Germany.  The study also calculates that cybercrime cost the USA over 200,000 jobs last year and predicts that the number of job losses will grow steadily as more businesses and individuals move online globally.  The most important cost of cybercrime is the damage it does to national economies due to the theft of intellectual property, the negative effect it has on innovators and investors, and the additional costs of securing networks, recovering from cyber-attacks and fixing damaged reputations.

The difference between cyberterrorism and cybercrime is subtle, but powerful.  The former is largely motivated by ideology and the latter by greed.    As bad as cybercrime may be, cyberterrorism could be much worse, especially if conducted by well-financed state-sponsored organizations with the intent to disrupt the stability of countries or destabilize the global balance of power.   In a world defined by different ideologies, cyberterrorism could become the weapon of choice that can be deployed directly or as a clandestine element of indirect warfare via surrogates who can provide plausible deniability for the originator.   As a superpower, the US tends to prefer direct warfare.  America’s less-resourced enemies tend to prefer the asymmetric advantages of indirect warfare to exploit America’s largest vulnerability—its openness.   Since the NTR is a global revolution, NTR technology, processes and systems will be available to a wide array of American adversaries.  Properly orchestrated, NTR could be used as a weapon of mass disruption by cyberterrorists.

Cybercrime and cyberterrorism will be growth industries for the foreseeable future.  Consequently, it is imperative that government and major civilian institutions collect and publish data on adversaries and establish policies that will mitigate risk to the constituents they serve.  Today, the advantage is on the side of hackers and attackers as opposed to defenders.  Consequently, the US will need much more than an effective cyber-defense.  State-of-the-art cyber-offence weapons and cyber-ISR (intelligence, surveillance and reconnaissance) assets will be needed as well.   Without cyber-offence and cyber-ISR, major state-sponsored cyber-terror organizations cannot be held at bay.   For countries like Iran, Russia and China, a form of cyber-MAD (mutually assured destruction) could hold enemies at bay as was done during the Cold War.  For non-state actors like ISIS and Al Qaeda, MAD probably will not be effective.  However, cyber-ISR would be effective in identifying terrorists and their supporters, and the cyber-offense could take down their web-based command, control, recruiting and financial systems.

Until major policy changes are made and actions implemented, cybercrime and cyberterrorism are likely to be deleterious to the US economy and employment to the tune of hundreds of billions of dollars and millions of jobs.  NTR corporations should play a major role in counter-cybercrime and counter-cyberterrorism, since they are the ones who are building the very systems that could lead to their demise.

Disruption to Privacy.  Not all disruptions to privacy are unwanted.  Many have practical uses.   Geofencing is one such example.  Geofencing is a location-based application that lets administrators send messages to recipients entering a defined geographic area.  Ankle bracelets use geofencing.  Fleet managers use geofencing to keep drivers on route and on schedule.  Via geofencing, security managers are alerted if employees enter unauthorized areas or if RFID-tagged equipment is not where it should be.  Shopping malls use geofencing to send coupons to customer cellphones when near a participating store.

On the other hand, many disruptions to privacy are unwanted.  Resolving right-to-privacy against the right-of-the-public to obtain relevant information will prove to be a difficult and complex process.   In the physical world, the right-to-privacy is part of most legal traditions that restrains government and institutional actions that threaten a person’s right to seclusion, confidentiality and personal autonomy.  The virtual world is not yet limited to such traditions and may be largely immune to such limitations.

The Internet is the world’s largest ungoverned space not bound by territory and largely immune to political, legal and institutional forces.  The era of the cyber-paparazzi is just beginning.   Damaging information will be very hard to delete once it goes viral.  The “Celebgate” scandal—the hacking of approximately 200 nude celebrity photos in August 2014—shows that even stored cloud data may not be secure from invasions of privacy.  As evidenced by the hacker attacks to millions of big-box store customer accounts and the Assange/Snowden leaks of classified government data, intrusion of highly secured data is, and will continue, to be an issue.   Consequently, traditional privacy rights will be extremely difficult to preserve in tomorrow’s ultra-networked Internet-of-Everything world where everything of significance is recorded, cataloged and stored.  The NTR will make the delete button largely obsolete, especially for those with the intent and resources to retrieve even the most secure or supposedly destroyed digital data.

Big Data has already spawned a billion dollar a year data-brokering industry that lacks transparency and accountability.  Data-brokering involves the collection of information from the zettabytes of data within the realm of Big Data to produce detailed portraits of individual Americans and their buying habits.  According to a Federal Trade Commission report[10], data brokers collect personal information about consumers from a wide range of legal sources (public and private records, online activities, social media, credit card purchases, loyalty programs, magazine subscriptions, etc.) and provide it for a variety of purposes, including consumer profiling, identity management, marketing, political campaigns and fraud detection.   Profiles are often used to measure creditworthiness, insurance, employability, as well as inclusion or exclusion from social groups.   Profiles are often sold without the individual’s knowledge or ability to correct false or misleading information.   It is a sad aspect of today’s society that data brokers often know more about individuals than do their family and friends.

With the exception of politicians and celebrities, most people’s personal identity outweighs their online identity.  With the advent of the NTR, this is likely to change, especially for the millennial generation that was born into the digital age and have invested significant time and energy posting intimate details of their lives in social media.  Most of this online information is captured in some data center and ripe for harvesting.  A person’s online identity is becoming more and more important as people’s lives are correlated, cataloged and assigned to various economic, social, demographic, religious, political, cultural, geographic, educational and splinter groups.   It is conceivable that an online identity rating could be as important as today’s credit rating.  Identity managers will be needed to help individuals manage their online identity as well as correct or redact incorrect, misleading or malevolent content.

The European Court of Justice’s decision to introduce a mechanism for individuals to delete private information from Google will be a bellwether case that will be closely watched.  Even if the European Court is successful, it only addresses the tip of a very big data-storage iceberg.   Redaction of data that may reside in multiple locations with zettabytes of other data will be challenging to entirely identify, retrieve, redact and verify.

The Solution

Network Technology Revolution and Micro-Business Creation.   Jobenomics defines micro-businesses as very small (1-19 employees) and self-employed (0 employees other than the owner) businesses.   While the vast majority of micro-businesses stay small, some do not.  Bill Gates and Steve Jobs started a micro-business in 1975/76 and became the pioneers of the Internet Technology Revolution.  Today, Gates’ Microsoft and Jobs’ Apple are worth over $1 trillion, employ 225,000 people, and have facilitated the creation of millions of micro-businesses and tens of millions of other jobs.  The NTR has the same potential as its ITR predecessor if today’s pioneers enable the creation of millions of micro-businesses.

In the same way that the industrial age upended the agricultural age, the NTR will enable the information age to upend the industrial age and transform the American labor force as well as the very nature of work.  Micro-business will likely play a much larger role than ever before.   Jobs will increasingly be dissected into discrete tasks, which, in turn, will be addressed by temporary collectives and virtual organizations.  Team collaborative and management tools (such as SharePoint) will further create “contextual” work environments that rapidly form, perform, and then reform to address subsequent tasks.  More and more brick and mortar edifices will give way to hoteling and mobile computing.   Contingency workers (consultants, independent contractors, independent professionals, temporary contract workers, part-time workers, seasonal workers, freelancers, etc.) will continue to replace full-time employees.   Contingent work will significantly boost micro-business growth as contingency workers become the norm, up from 31% of the US labor force in 2008 to an estimated 40% in 2020[11].

NTR-enabled temporary alliances that can rapidly respond to short-term tasks are ideally suited for micro-businesses that tend to be more eager and entrepreneurial than big business.   Either by nature or by necessity, contingency workers are entrepreneurial, are a reasonable response to today’s changing marketplace, and offer firms workforce flexibility during seasonal or uncertain times.  On the negative side, firms can take advantage of contingency workers who often receive lower wages than permanent workers.   Since many contingency workers are not employees, they are not subject to labor and employment laws, nor does the firm has to pay employee-related benefits and taxes.  The way to mitigate many of these negatives is to encourage contingency workers to incorporate their own micro-businesses that will provide tax revenues, labor and employment.

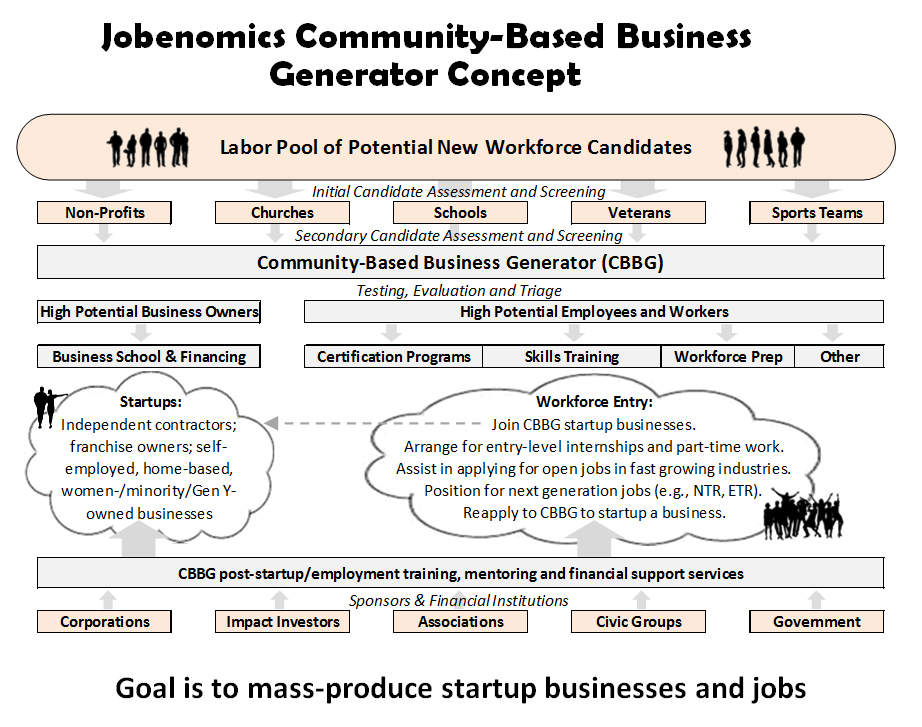
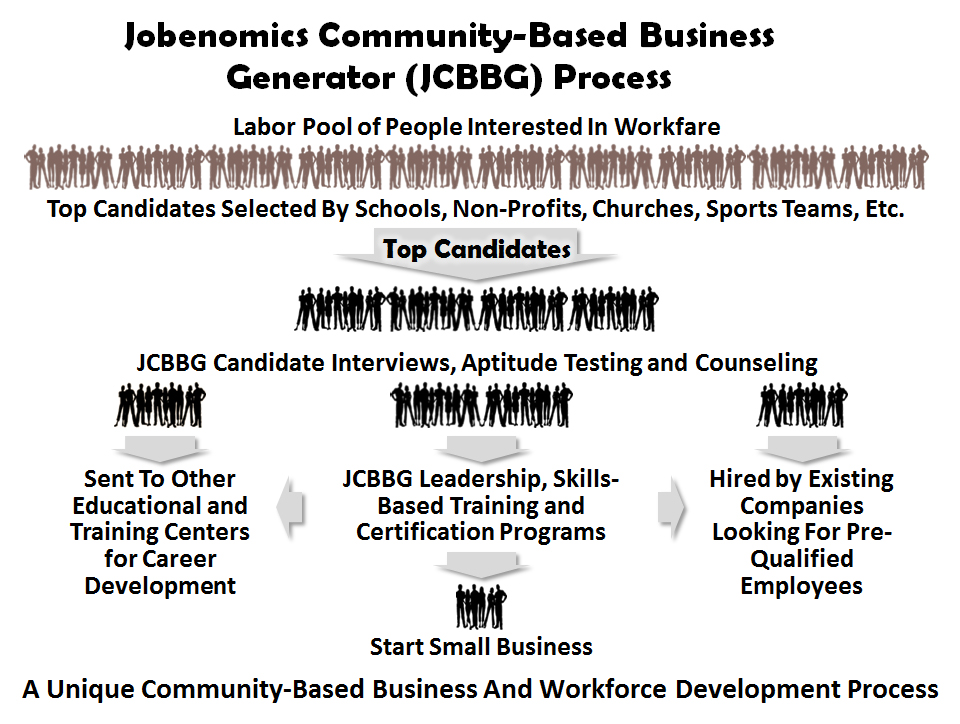
Jobenomics believes that an American NTR Micro-Business Initiative could boost American employment by over 20 million people within a decade.  Most government and big business pundits consider this wishful thinking.  But ask any small business owner or serial entrepreneur if this is doable and they would say “Absolutely!”   If the CEOs of America’s leading NTR corporations collaborated to monetize the social networks that they control, millions of new US micro-businesses could emerge.  Jobenomics invites CEO participation to build local business generators that mass-produce micro-businesses at the base of America’s economic pyramid.  The objective of the Jobenomics Community-Based Business Generator initiative is to increase birth rates of startup businesses, extend the life span of existing businesses, and increase the number of employees per business.

Jobenomics predicts that the NTR could enable the mass production of millions of micro-businesses.   The NTR could be the great business equalizer that allows home-based, self-employed businesses to compete globally with much larger firms.  Today, WWW 2.0 social networks focus mainly on media, entertainment and shopping.  Tomorrow’s WWW 3.0 social networks may be able to monetize the World Wide Web, creating tens of millions of new jobs.   eBay, a WWW 2.0 startup in 1995, is now a multi-billion dollar enterprise located in over 30 countries, with 31,500 employees that enable millions of global micro-businesses.   If properly supported, WWW 3.0 could create dozens of eBay 3.0-like enterprises.

As mentioned earlier, Alibaba defines its role as a small business champion and is aggressively supporting millions of business startups and existing business expansion in China.  In 2013, two of Alibaba’s web stores (Taobao’s consumer-to-consumer store and Tmall’s business-to-consumer store) handled $240 billion in sales, more than eBay and Amazon combined, and are on track to handle $1 trillion per year[12] in transactions with emphasis on small business.  Alibaba provides free startup services and micro-business loans as part of their network services.  According to Alibaba, their micro-business loan book is over $2 billion/year with a non-performing-loan ratio below 2%.  With an average loan of $8,000, Alibaba underwrites approximately 250,000 micro-businesses per year.

If Mark Zuckerberg used Facebook to monetize social networks, millions of new jobs could be created.  If John Chambers spent as much time developing the Internet of Business as opposed to CISCO’s Internet of Things, millions of new businesses could be created.  If Tim Cook turned Apple’s creative energy to creating NTR-optimized iBusiness devices, billions of people around the world could be given the opportunity to conduct or build a business.   The same is true of Jeff Bezos and Amazon, Satya Nadella and Microsoft, Larry Page and Google, Ginni Rometty and IBM, as well as the rest of the American CEOs involved in the NTR.

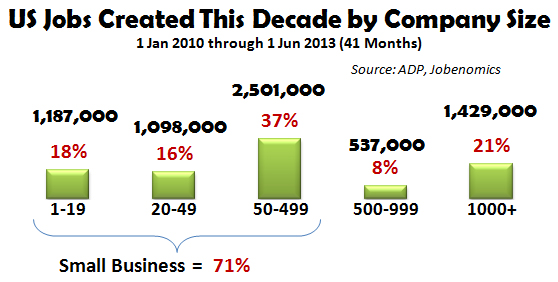
Small business is the engine of the US economy.  According to the US Small Business Administration[13]  there are 17,700 big businesses and 28.2 million small businesses with fewer than 500 employees.  Of the 28.2 million small businesses, approximately 5 million are employers and 23 million are self-employed.   As reported by the ADP National Employment Report[14], small businesses employ 77% of all private sector Americans with a total of 88.7 million employees—5 times the amount of large corporations (1000+ employees).  Very small businesses with fewer than 19 employees employ 65% more than all large corporations combined (29.7M versus 18.0M).  Since the beginning of this decade, small business has produced 73% of all new American jobs.  This is an amazing statistic, considering the adverse lending environment, mounting regulation, and the pittance of government funds allocated to small businesses.

Jobenomics believes the four US micro-business sectors with the highest growth potential are Generation Y-owned, Women-owned, Minority-owned, and Veteran-owned businesses.  In this regard, Jobenomics has been collaborating with experts on how to enable micro-business creation in these four sectors.  Their recommendation was to create a holistic web-based platform with back office and subscription services for startups.  This platform would provide a turnkey solution including e-commerce, secure cloud computing, semantic webs, financing, loans and mentoring.  These services would initially be free to encourage the participation of aspiring entrepreneurs and contingency workers who would like to be business owners.

If Jobenomics can help create thousands of highly-scalable micro-businesses, via the Network Technology Revolution, America writ-large can facilitate creation of millions of micro-businesses that would transform the US economy.  With the leadership and commitment of the leading NTR corporations, 2015 could be a break-out year for small businesses that traditionally have been the primary source of employment for entry-level workers and the long-term unemployed.

Conclusion

In conclusion, the Network Technology Revolution can be either a blessing or a curse depending on how it is managed.  If managed properly, it can generate millions of new businesses and tens of millions of new jobs.  If poorly managed, the effects of computerization could potentially eliminate tens of millions of current US jobs, as well as disrupt the US economy.  From a Jobenomics perspective, the onus is on the leading NTR corporations—the pioneers of the 21st century digital age.  It is within their capability, and self-interest, to maximize the benefit of the emerging NTR technologies, processes and systems that they are developing.  If they don’t, others around the world will, as history attests.

The phrase “Nation of Shopkeepers” first appeared in The Wealth of Nations by Adam Smith in 1776. Smith believed that when individuals pursue their self-interest, they indirectly promote the greater good of society. Smith argued that merchants, seeking their own self-interests, contribute significantly to the commonwealth by producing vital goods, services and tax revenues. Without this “invisible hand,” societies would be incapable of effectively pursuing self-sufficiency, prosperity and wealth creation.  Jobenomics agrees and believes that the United States is likely to further evolve into a “Nation of Small Businesses” as we exploit economic opportunities enabled by the Network Technology Revolution.


[1] Kauffman Foundation, The Importance of Startups in Job Creation and Job Destruction, 9 Sep 2010, http://www.kauffman.org/what-we-do/research/firm-formation-and-growth-series/the-importance-of-startups-in-job-creation-and-job-destruction

[2] Ibid 1, last paragraph

3 Oxford University, The Future of Employment: How Susceptible Are Jobs To Computerization?, 17 Sep 2013, http://www.oxfordmartin.ox.ac.uk/downloads/academic/The_Future_of_Employment.pdfhttp://www.oxfordmartin.ox.ac.uk/downloads/academic/The_Future_of_Employment.pdf

[4] S Bureau of Labor Statistics, Job Openings and Labor Survey, http://www.bls.gov/news.release/jolts.htm

[5] US Bureau of Labor Statistics, Employment Situation Summary, http://www.bls.gov/news.release/empsit.nr0.htm

[6] CISCO, Cisco Visual Networking Index: Forecast and Methodology, 2013–2018 by Device Type, http://www.cisco.com/c/en/us/solutions/collateral/service-provider/ip-ngn-ip-next-generation-network/white_paper_c11-481360.pdf

[7] Gartner Worldwide IT Spending Forecast, http://www.gartner.com/technology/research/it-spending-forecast/

[8] Ibid 12

[9] Center for Strategic and International Studies and McAfee study: Net Losses: Estimating the Global Cost of Cybercrime, June 2014, http://csis.org/files/attachments/140609_rp_economic_impact_cybercrime_report.pdf

[10] Federal Trade Commission, Data Brokers, May 2014,  http://www.ftc.gov/system/files/documents/reports/data-brokers-call-transparency-accountability-report-federal-trade-commission-may-2014/140527databrokerreport.pdf

[11] Bloomberg Business Week, 20-25 October 2014 Edition, Companies/Industries, Page20

[12] International Business Times, Alibaba IPO: 5 Reasons Why The Stock Is Not Overvalued, 19 Sep 2014, Gordon Orr, Chairman of McKinsey Asia, http://www.ibtimes.com/alibaba-ipo-5-reasons-why-stock-not-overvalued-1692191

[13] US Small Business Administration, Office of Advocacy, http://www.sba.gov/sites/default/files/advocacy/FAQ_March_2014_0.pdf

[14] ADP National Employment Report, http://www.adpemploymentreport.com/

Minority-Owned Businesses

Download PDF Version: Minority-Owned Businesses - 10 Jan 2014

Minority-Owned Businesses

www.Jobenomics.com

By: Chuck Vollmer

10 January 2014

Executive Summary.   Today, there are 6 million minority-owned businesses in the US.  Jobenomics advocates a national goal of 18 million by year 2020—a goal that is achievable and necessary.  Race and ethnicity are important elements of America’s economic equation.  Jobenomics forecasts that income opportunity (see Income Inequality versus Opportunity posting) will become a leading domestic issue as minorities assert their growing demographic, economic and political power.    Racial and ethnic minorities currently constitute 40.8% of the US population, and are responsible for approximately $3 trillion worth of America’s expenditures and consumption for goods and services (see Consumption-Based Economy posting).   This degree of economic power could fuel the creation of millions of minority-owned businesses that would provide income opportunity for millions of Americans.

US Demographic Trends

US Minority Demographic Trends.  Today, minorities comprise about 41% of the US population, but will be in the majority much sooner than most people recognize.   According to the US Census Bureau[1], for the first time in American history, most (50.4%) American children younger than age 1 are now racial and ethnic minorities.  Consequently, America could be a generation away from being a minority-majority nation—perhaps quicker, considering aging baby-boomers and low birth rates in the White-majority.   California (60.3% minorities), Texas (55.2%), New Mexico (59.8%) and Hawaii (77.1%) are already minority-majority states.

 US Demographic Profile

According to 2010 Census data[2], the largest minority group is Hispanics and Latinos (Hispanic) with 50.5 million people, followed by African-Americans (Black) with 38.9 million, Asian-Americans (Asian) with 14.7 million, American and Alaskan Natives with 2.9 million, Native Hawaiian and Other Pacific Islanders with 0.5 million, and “Some Other Race” with 19.1 million.  An additional 9 million Americans identified themselves as multi-racial from two or more races.  196.8 million Americans identified themselves as non-Hispanic Whites (White)—a 59.2% majority compared to a minority population of 40.8%.

Between 2000 and 2010, the White population grew by 2.3 million or 1.2%.   Asians and Hispanics were the fastest-growing groups by percentage, or 43.3% and 43.0% respectively.   The Hispanic population increased by 15.2 million between 2000 and 2010, accounting for half of total US population growth.   Blacks grew at a rate of 12.3% for a total gain of 4.3 million over the decade.  Asians added 4.4 million during this period.  All other minority groups grew by 6.5 million at a combined rate of 26%. 

Minorities in the US Labor Force.   The US Department of Labor’s Bureau of Labor Statistics (BLS) recently completed a landmark study[3] regarding US labor force characteristics by race and ethnicity[4].  The three major minority groups that the BLS studied were Black, Hispanic and Asian.   The following charts were created by Jobenomics using data from the BLS study to compare these major US minority groups’ employment and income characteristics to those of Whites.  While important, smaller minority groups (American Indian, Alaskan Native, Native Hawaiian, Other Pacific Islanders, and people who identified themselves as multi-racial or from some other race) are not included in this analysis due to limited numbers (only 2.5% of the US labor force).

The US Civilian Labor Force includes all working-age persons who are employed or unemployed and looking for a job.  In 2011, the US civilian labor force was 153.6 million out of a total population of approximately 309 million.   Whites dominated the US labor force with 67% (103.3 million workers) of all workers, followed by Hispanics with 15% (22.9 million), Blacks with 11% (17.1 million) and Asians with 3% (4.7 million).

As shown in the following series of charts, employment in the five major occupational categories is more equally distributed between races/ethnicities than the 67% manpower advantage would imply.

 Median Weekly Earnings By Occupation

As shown above, the five major occupational categories range from management on top, to service on the bottom in terms of median weekly earnings[5].  Based on these five categories, the three major minority groups fared reasonably well against the White majority as indicated in the following charts.

 Occupational Employment of Men

As a percentage of their group, Asian men (49%) were the most likely to be employed in the top category of “management, professional and related occupations” compared to Whites (35%), Blacks (24%) and Hispanics (16%).  In “sales and office occupations” all four groups were relatively equally represented (17%, 18%, 15% and 17%).  “Natural resources, construction and maintenance occupations” were dominated by Hispanics and Whites.  “Production, transportation and material moving occupations” as well as “service occupations” were led by Blacks and Hispanics over Whites and Asians by 22% versus 14% of their respective work forces.

 Occupational Employment of Women

As a percentage of their group, Asian women (44%) were the most likely to be employed in the top category of “management, professional and related occupations” compared to Whites (42%), Blacks (34%) and Hispanics (25%).  In “sales and office occupations” all four groups were relatively equally represented (26%, 31%, 32% and 32%).  Women were not a major contributor by employment in the “Natural resources, construction and maintenance occupations” category.  “Production, transportation and material moving occupations” were relatively equal amongst all women subgroups with Hispanic women having a slight edge.   “Service occupations” were relatively close amongst all women subgroups with Hispanics (31%) followed by Blacks (28%), Asians (22%) and Whites (20%).

It is important to note that these two Occupation Employment charts are calculated as a percentage of their group, as opposed to a percentage of total employed, which, as discussed earlier, is dominated (67%) by Whites.   For example, Asian-male participation in the “management, professional and related occupations” category is better represented by 49% (percentage of their group) than 5.4% (percentage of the total employed) as reported by other BLS surveys[6].   49% reflects that almost half of all working Asian-males are involved in management and professional occupations—an impressive percentage.  5.4% indicates only a small number of Asians are in management and professional occupations compared to the total working population—an unimpressive percentage—that does not account for the fact that the total number of Asians only represents 1/20th of the US work force.  Consequently, major minority groups are faring much better regarding labor force participation than the media and political activists often portray by using percentage of total employed statistics.

Income and Unemployment Inequities.   While Jobenomics asserts that minority groups fare much better in the US labor force than generally perceived, Jobenomics also acknowledges that there are inequities that need to be fixed, especially in the Hispanic and Black subgroups.

 Median US Household Income

According to the most recent US Census Bureau report[7], US median household income has fallen by 9% since 2007, hurting all Americans regardless of race or ethnicity.  Today, the US Asian community maintains the highest median household income of $65,129, followed by Whites ($55,412), Hispanics ($38,624) and Blacks ($32,229).

 Employment-Population Ratio

Over the decades, income inequality has remained relatively the same between the races, collectively increasing during good times, and collectively decreasing over bad times.  During the good times, income inequality was not a politically-charged issue since increasing household income provided a sense of well-being.  Since year 2000, the US Employment-Population Ratio has decreased 9.4% with the greatest impact on the middle-class.  During the last six years, the precipitous decline in household income significantly impacted the Black and Hispanic communities that were especially hard-hit during the Great Recession, largely due to the mortgage crisis and the erosion of middle-class jobs.  As shown above, over the last three years, the Employment-Population Ratio has flatlined, causing considerable anxiety and discord regarding limited income opportunity.

 Unemployment Rate

Since the Great Recession, unemployment increased for all Americans, but the Black and Hispanic groups were hit the worst, with current unemployment rates[8] at 13.8% for Blacks and 9.6% for Hispanics, compared to 6.8% for Whites and 5.1% for Asians (not shown on chart due to limited historical data).

Youth unemployment is even more egregious, especially for Black youths aged 16 to 19 years old, which is 38.2% compared to 20.5% for Whites[9].

In summary, Jobenomics concludes that, institutionally, minority groups are not having a major issue with participation.  The Asian minority group is doing quite well exceeding White participation in top paying occupations.  While Black and Hispanic groups lag behind Whites in participation, they are not lagging by a great extent.  On the other hand, Blacks and Hispanics are challenged by their concentration in lower labor categories, high unemployment rates and depressed household incomes.

Minority-Owned Businesses.   From a Jobenomics perspective, the primary solution to enhancing minority labor force participation and increasing wealth in minority communities involves minority-owned business creation, which is growing at twice the rate of all US business.  If America exploits this trend, millions of minority-owned businesses could be created providing many millions of jobs.

U.S. Census Bureau performs a Survey of Business Owners twice each decade.  A survey was conducted in 2007 and the results released in 2011—the latest data available.  A survey was conducted in 2012, but the results will not be released until 2015.

Highlights of the 2007 Survey of Business Owners [10] include:

  • In 2007, more than one-fifth (21.3%) of the nation’s 27.1 million firms were minority-owned.
  • In 2007, minority-owned firms numbered 5.8 million, up from 4.0 million in 2002, an increase of 45.5%—more than double the 17.9% increase for all US businesses. Receipts of minority-owned firms increased 55.0% to $1.0 trillion over the five-year period, compared with the 32.9% increase for all businesses nationwide.
  • Of the 5.8 million minority-owned firms, 766,533 had paid employees, an increase of 21.7% from 2002. These firms employed 5.8 million people, a 24.4% increase from 2002, and their payrolls totaled $164.1 billion, an increase of 42.2%. Receipts of minority-owned employer firms totaled $860.5 billion, an increase of 54.3% from 2002.
  • In 2007, minority firms with no paid employees (mainly self-employed businesses and partners of unincorporated businesses) numbered 5.0 million, an increase of 50.0% from 2002. These firms had receipts totaling $164.3 billion, an increase of 58.9%.
  • Black-owned businesses grew to 1.9 million firms in 2007, up 61% from 2002 - the largest increase among all minority-owned companies; and generated $135.6 billion in gross receipts, up 53% from 2002.  Black-owned firms accounted for 7.1% of all US businesses and employed 921,032 persons.
  • The number of Hispanic-owned businesses totaled 2.3 million (8.3% of all US businesses) in 2007, up 44% from 2002. Receipts for Hispanic firms increased 55% to $343.3 billion.
  • Asian-owned firms grew 41% from 2002 to 1.6 million. Asian-owned firms continue to generate the highest annual gross receipts at $510.1 billion in 2007, increasing 56% from 2002.

Jobenomics believes that doubling or tripling minority-owned businesses from 5.8 million to 11.6 million or 17.4 million is very achievable within a decade—if American communities implement viable plans that emphasize highly-scalable small, emerging and self-employed business creation.

Jobenomics Minority-Owned Business Creation Initiatives.   Over the last two years, Jobenomics met with minority leaders in dozens of cities to discuss minority-owned business, wealth creation and meaningful jobs creation.  These cities include Harlem (NY), Washington DC, Atlanta, Detroit, Chicago, Phoenix, Fort Worth, Philadelphia, San Diego, Las Vegas, Honolulu, Greensboro (NC), Wilmington (DE), Roanoke (VA), Chester (PA) and Bridgeport (CT).  What we learned was encouraging—even in the most financially depressed inner-cities.

It was encouraging to find a high degree of entrepreneurial spirit and willingness to create minority-owned business.  However, most government and community leaders have relatively little business experience, especially with start-ups and self-employed businesses.  To compensate for inexperience, they tend to look to Washington or big-business that has not produced any net new jobs in the last several decades.  Jobenomics contends that the most reliable source of guidance resides in innovators and serial-entrepreneurs.  Various governmental small business agencies and associations do an adequate job of counseling and providing grants, but have little expertise in mass-producing highly-scalable small businesses.

The Father of American Education, Horace Mann, stated that “education is the great equalizer of the conditions of men, the balance-wheel of social machinery.”  While Jobenomics agrees, the educational paradigm in yesteryear was much different than today.  The old paradigm, “get an education to get a job…get a better education to get a better job” simply does not work in today’s high-tech, slow-growth economy where middle-class jobs are increasingly outsourced overseas.  Most citizens in inner-cities need basic skills as opposed to higher education.  If 40% of college graduates have difficulty finding jobs, how can a high school dropout hope to find work?

From a Jobenomics perspective, basic skills include communication, tradecraft and business.  For inner-cities, Jobenomics focuses first on business creation.  Small businesses offer the fastest way out of poverty through employment for the unemployed.  Every city should have a community-based business generator that mass produces highly-scalable businesses.  Our second priority is tradecraft—a skill acquired through experience in a trade—with emphasis on skilled service businesses.  The third area is communications.  In a business sense, communications entails the ability to express and demonstrate one’s value-proposition.

Jobenomics Community-Based Generators (1) identify and train potential business leaders and business owners, (2) implement highly repeatable and scalable businesses with emphasis on service-providing businesses, (3) establish sources of start-up funding, recurring funding and contracts to provide a consistent source of revenue for new businesses, and (4) provide post start-up business support.

Many metropolitan areas have business incubators that are oriented to emerging high-tech and manufacturing businesses.  These incubators are often located in affluent areas or high-tech corridors.  Jobenomics offers a complementary concept that focuses on business generators that are oriented towards trade-level, service-providing businesses in economically-depressed areas.  Rather than incubating innovative business opportunities one-by-one, a business generator mass produces highly-scalable, start-up businesses.  When fully operational, the community-based generator will be capable of creating 1,000 new small businesses per year.

Jobenomics has three fledgling Jobenomics Community-Based Generator projects underway in College Park (Atlanta), Harlem (New York City) and Detroit.  Jobenomics is in the process of establishing networks of local non-profit and educational institutions to identify entrepreneurial talent.  Once identified, the Community-Based Generator will evaluate candidates via self-employment surveys (see initial self-employment survey at www.Jobenomics.com) and counseling to determine their suitability for business ownership and the type of business.

Following the evaluation phase, candidates will undergo a training, certification and implementation process.  Classes will be taught by successful small business owners and entrepreneurs with expertise in startup business implementation.   By the end of the program the clients will have:

  • An Employer Identification Number (EIN), incorporation (S-Corp, C-Corp or Limited Liability Corporation), and the essentials to run a fully functional company (accounting systems, business plans, legal/regulatory, branding/marketing/sales, financing, etc.).
  • A computer supplied with accounting, business planning and website/social networking systems.  Training will also be provided including how to obtain appropriate accounting (e.g., bookkeeping and CPA), information technology, and sales/marketing/ advertising/branding support after graduation from the center.
  • Supplementary business systems (e.g., website, social networking, bank accounts, etc.) that will facilitate the promotion of the new business.
  • Understanding on how to access government grants and investment capital.
  • A network of entrepreneurial organizations and on-going business support.

eCyclingUSA-JobenomicsJobenomics founded eCyclingUSA™ (www.ecyclingUSA.com) as part of its green-jobs initiative and a way to fund community-based business generators in metropolitan areas.  Each month, city managers give away millions of tons of whiteware (e.g., appliances) and other electronic waste (computers and televisions) that contain tens of millions of dollar’s worth of minerals (e.g., copper, aluminum, precious metals) that can be reclaimed, sold on the commodities market or used to develop local industries.  eCyclingUSA technology is in operation in 60 plants across Europe.  eCyclingUSA plans to implement 50 sites across the US and is committed to donating a minimum of 10% of its annual profits (between $1 and $3 million per year per site) to fund Jobenomics Community-Based Business Generators.


[1] US Census Bureau, Most Children Younger Than Age 1 are Minorities, 17 May 2012, http://www.census.gov/newsroom/releases/archives/population/cb12-90.html

[2] US Census Bureau, 2010 Census Briefs, Overview of Race and Hispanic Origin: 2010, March 2011, Table 1.  Population by Hispanic or Latino Origin and by Race for the United States: 2000 and 2010, http://www.census.gov/prod/cen2010/briefs/c2010br-02.pdf

[3] US Department of Labor, Bureau of Labor Statistics, Labor Force Characteristics by Race and Ethnicity 2011, Report 1036, published August 2012 and updated 6 June 2013, http://www.bls.gov/cps/cpsrace2011.pdf

[4] Note: the BLS reports monthly on White, Black and Asian groups but not Hispanics. Consequently, this 2011 report provides the latest official US government “apples-to-apples” comparisons of all four groups.

[5] BLS, Median weekly earnings by race, ethnicity, and occupation, first quarter 2012, http://www.bls.gov/opub/ted/2012/ted_20120419_data.htm

[6] BLS, Household Data Annual Averages, Table 11, Employed persons by detailed occupation, sex, race and Hispanic or Latino ethnicity, Year 2012 (retrieved 12 Sep 2013), http://www.bls.gov/cps/cpsaat11.pdf

[7] US Census Bureau, Income, Poverty, and Health Insurance Coverage in the United States: 2011, by Carmen DeNavas-Walt, Bernadette D. Proctor and Jessica C. Smith, http://www.census.gov/prod/2012pubs/p60-243.pdf, issued September 2012

[8] BLS, Unemployment rate by age, race, and Hispanic or Latino ethnicity, January 2008–February 2013, http://www.bls.gov/opub/ted/2013/ted_20130312.htm

[9] BLS, Table A-2 Employment status of the civilian population by race, sex, and age, September 2013, http://www.bls.gov/news.release/empsit.t02.htm

[10] US Census Bureau, 2007 Survey of Business Owners, http://www.census.gov/econ/sbo/

Consumption-Based Economy

Download PDF Version: Consumption-Based Economy 2 Sep 2013

2 September 2013

The USA is a consumption-based economy and America is a consumption-driven society.  Neither fact is necessarily good or bad.  It is the way America has operated for a century.  The issues at hand are (1) whether America can sustain high rates of consumption in an ever changing geo-political/economic environment, and (2) what are the consequences of a reduced consumption-based economy?

Consumption is an economic function that is defined as the value of all goods and services bought by people.   Leading economists determine the performance of a country in terms of consumption level and consumer dynamics.  The underlying theory of a consumption-based economy is that progressively greater consumption of goods is economically beneficial.   Jobenomics believes that this theory is only partly true.  Production, not consumption, is the true source of wealth.  Production uses resources to create goods and services that are suitable for use or exchange in a market economy.   If America wants a healthy economy, we need to create the conditions under which producers (businesses as opposed to governments) can accelerate the process of creating wealth for others to consume and finance future production.

To better understand the dynamics of our consumption-based economy, let’s first examine US consumption statistics, and then address consumption-based economy sustainability, potential consequences of reduced consumption, and Jobenomics recommendations.


US Consumption Statistics.   The US is consumption-based society where spending and consumption of goods and services are essential to economic health.   In America’s pre-consumer era, the US economy was based on agriculture and cottage industries where citizens produced what they needed and traded the rest.  Non essential consumption was largely the privilege of an elite few.  Over the last century, consumerism was introduced to the masses as part of the American economic equation.  Today, consumption is no longer a privilege but a necessity.  Increased consumption is necessary to keep the economy growing.  Without increased consumption, the economy would falter.

To sustain a growing economy, government, financial institutions and corporations must motivate citizens to keep consuming to preserve our way of life.  Modern-day Americans are programmed to be good consumers.    It is estimated[1] that an average American child watches 20,000 TV commercials per year.  By age 65, the average American watches 2 million commercials.  We are programmed for mega-consumption for special occasions, like Christmas that evokes $80 billion worth of gift-giving.  When an event, like 9/11 or the Great Recession of 2008-09, happens the federal government steps in to encourage consumption.  The Monday following the 9/11 Trade Tower attacks, the White House encouraged American’s to continue shopping due to fears that Wall Street would falter if consumer confidence plummeted.  At the advent of the Great Recession, the federal government implemented a series of bailouts, buyouts and stimuli to keep financial institutions and corporations afloat in order to stimulate our consumption-based economy.  These federal stimuli continue today to the tune of $16.6 trillion (see http://jobenomicsblog.com/stock-markets-and-the-fed), which is in addition to the $3.5 trillion spent annually for federal goods and services.

 International Comparison of Consumption as a Percent of GDP

According to The World Bank[2], the United States is the largest and most conspicuous consumption-based economy in the world.   As shown, the US leads the world with 71% consumption as a percent of US gross domestic product (GDP, the sum of all goods and services produced in the US by Americans).  Other Western economies average about 60%.  Emerging economies average around 35%.

China, as true with many developing countries, depends on government-funded investment to encourage economic expansion.    Chinese household consumption expenditure is 34% where government investment is approximately 54%.  Most of this government investment comes from the Chinese government to large state-owned corporations that are granted easy access to capital for development of factories, real estate and infrastructure.

 Personal Consumption Expenditures as a Percent of US GDP-3

The overwhelming percentage of GDP is generated by personal consumption and expenditures as shown above.  The US Federal Reserve System (the central bank of the United States) reports monthly[3] on the various components US GDP.  For 2013, personal consumption and expenditures amounts to $11.4 trillion out of a total GDP of $16.0 trillion, or 71% of the total.  Government consumption, expenditures and investments amount to $3.0 trillion, or 20% of the total.  Private domestic investment (mainly businesses and real estate investments) accounts for $2.2 trillion, or 13%.  The final component is net US imports/exports, which is a negative $500 billion (-4%) since foreign imports exceed US overseas exports in our consumption-based economy.

 Personal Consumption Expenditures as a Percent of US GDP by Decade

US personal consumption rose over the last seven decades as a percentage of US GDP—ranging from a low of 62% to a high of 71% today.   It is interesting to note that the two recessions in the decade of the 2000s did not decrease the ever growing amount of consumer spending.

 Personal Consumption Expenditures by Major Product Type

As estimated by the US Bureau of Economic Analysis[4], personal consumer spending has reached an all time high of $11.4 trillion in year 2013.  From 1959 (earliest BEA records) to 1970, consumption of goods exceeded services.   After 1970, services rapidly exceeded goods.  Today, the US consumes $7.5 trillion worth of services and $3.9 trillion worth of goods.   In other words, the US is a services-oriented, consumption-based society by a factor of almost 2 to 1.

 What Americans Buy and Consume

Americans consume a vast variety of goods and services[5] with healthcare (21.0%), housing (18.8%) and recreation/entertainment (10.2%) topping the list.   Surprisingly, Americans spend more on entertaining themselves (recreation and entertainment, 8.9%) than they do on groceries (food and beverages, 8%)—a sign of “conspicuous consumption”.

Conspicuous consumption is generally defined as spending on goods and services mainly for the purpose of displaying income, wealth or social status.  Consumers naturally want the latest gizmos and to keep up with the “Jones”.  However, advertising, easy money (credit) and federal stimuli encourage consumption practices that far outstrip our ability to pay.  It is this inability to pay—both in government and the private sectors—that puts the American economy at risk.

America has a consumption conundrum.   On one hand, the US economy is dominated by consumption (71%) that must be maintained in order for the economy to prosper.  On the other hand, conspicuous, unneeded or unessential consumption without the ability to repay spiraling indebtedness risks defaults, ever higher interest rates, and bankruptcy.  Approximately 50,000 businesses and 1 million individuals file for bankruptcy each year[6].  Bankruptcies in major cities, like Stockton, Harrisburg and Detroit, indicate that something is amiss.


Consumption-Based Economy Sustainability.  Is our consumption-based economy sustainable?  Jobenomics assesses the short-term outlook as favorable and the long-term outlook as unfavorable.  However, the long-term outlook could be favorable if the American populace and their elected leaders exploit the advantages of the US labor force and solve a number of significant challenges facing US economic growth.

Americans have a number of advantages in regard to the global economy.  Primary advantages include inertia, innovation, adaptability, natural resources, and the dollar as the world’s currency—all of which will sustain the US economy in the short-term.

  • In physics, inertia is defined as a property of matter to retain its momentum in the absence of an external force.  The same is true of our consumption-based economy that has retained momentum over the last five decades as shown on the 1959 to 2012 Personal Consumption/Expenditures by Major Types of Product  chart .  Even the Great Recession of 2008-2009 caused only a temporary speed-bump in US personal consumption expenditures.  Even with all its challenges, the US economy is still the largest, most vibrant and the most stable in the world.
  • Innovation is part of the American fabric.  Historically, Americans have been the first to embrace disruptive technologies that transform life, business and the global economy.  US innovators and entrepreneurs have revolutionized our society many times in the last century from the military-technological revolution in the 1950s/60s, to the information-technology revolution in the 1980s/90s and todays energy-technology revolution.
  • Americans adapt to change.  Within the last 200 years, Americans transitioned from: pre-consumer to consumption-based, agriculturally-based to industrial-based, industrially-based to information technology-based, from dependence on goods to services, as well as rural to urban.   In 1810, only 6.1% of Americans lived in cities.  By 1910, 45.6% lived in cities.  Today, 80.7% of all Americans live are urbanites.
  • Unlike most countries, America has ample resources.  The most important resource is human.  When we run short of human resources, America has been able to attract and retain foreign talent.  The second most important resources is natural.  We have abundant supply of arable land, water and energy.  Our challenge is to husband these resources in an economically and environmentally balanced way.
  • The dollar is the world’s reserve currency. While there is a lot of talk about replacing the dollar with a new form of global currency based on a “basket” of currencies or commodities, the dollar should remain the world’s currency in near future.  Being the world’s reserve currency, allows the US federal government to print and borrow money to manage its cash flow needs.  This is not true of almost any other country on earth.


However, America has a number of significant challenges to include debt/deficits, fiscal/monetary policy, financial disruptions and demographics that could upend our consumption-based economy.

  • The US is now the greatest debtor nation in the world.  Over-consumption caused US private and public debt (the total of all US government, households, corporations and financial institutions) to surge upward to $45 trillion, or 300% of US GDP.  Eventually these debts will be reconciled via dollar devaluation, increased interest payments, defaults or high inflation.
  • The US Congress is responsible for fiscal policy (tax and spending) and the US Federal Reserve System is responsible for monetary policy (printing money and setting interest rates).  As long as the US Congress spends $1 trillion more each year than it takes in taxes and the Fed continues to stimulate the economy at an average of $1 trillion a year, consumption will continue unabated with copious amounts of “easy” money.   This rate of spending cannot last.  Hopefully, the US economy will strong enough to operate on its own when government stimuli end.
  • Domestic financial disruptions, like recessions and periods of inflation, and occur frequently.  Since WWII, the US averaged 1.7 recessions per decade.  So far in this decade (2010 to today), the US has been recession-free mainly due to infusion of trillions of dollars worth of government stimuli.   Inflation is also a major consideration.  So far in 2013, inflation has averaged 1.5%, which is in the normal range.  In 2008, prior to the Great Recession, it was 5.6%.  In 1980, it was 14.7%.  When government stimuli end, many fear that inflation will increase, perhaps significantly.  The next recession and/or an inflationary spiral could be very deleterious to consumption.
  • Global financial disruptions caused by political, economic, military or social malfeasance could trigger changes to US consumption.  Europe and Japan are in recession.  Conflicts in the Middle East continue.  Competition from China remains unabated.  It is unlikely that a single global disruption will have a significant impact on US consumption.  However, a global disruption may have a multiplying effect making a domestic financial disruption worse.  Multiple or cascading global disruptions, especially with our key trading partners, would certainly have an adverse affect on the US economy.
  • US demographic trends signal reduced consumption.   78 million baby-boomers just began to retire.  Retirees are generally fiscally conservative and less prone to large expenditures.  The other demographic group that is buying less is the middle class.  Since year 2000, the middle class has decreased by approximately 6%.  In the same period of time, the number of able-bodied Americans that can work but choose not to work has grown by 20 million people to a total of 90 million, not including 70 million people that cannot work, out of a total population of 316 million.


Potential Consequences of Reduced Consumption.    Depending how the US economy is managed or mismanaged, the consequences of reduced consumption can range from benign to malignant.  The longer we wait to implement meaningful reforms to our long-term challenges the more severe the consequences of reduced consumption.

Unemployment is directly tied to consumption.  One can roughly calculate the consequence a relatively minor drop of 5% in consumption and its impact on unemployment.  A 5% reduction in the US $16 trillion annual GDP would precipitate a loss of approximately 20 million jobs ($16 trillion GDP x 5% = $800 billion/$40,000 annual median personal income = 20,000,000 jobs).  Today, the US employs a total of 136 million citizens, so a reduction of 20 million jobs would equate to approximately 15% of the US work force.   If the layoffs were focused on the poor and the lower middle class making an average personal income of $20,000, the numbers could double.

As shown on the International Comparison chart at the beginning of this article, a 5% reduction in GDP would still make the US highest consuming society tied with the UK at 66%.  Given the volatility in today’s geo-political/economic environment, financial disruptions should be anticipated. Given the severity, duration and number of disruptions, a 5% (or greater) drop is certainly in the realm of the possible.


Jobenomics Recommendations.   Jobenomics believes that the best way to mitigate the effects of a potential consumption downturn is to promote small business growth as opposed to massive stimulus packages oriented to government jobs, big business and large financial institutions. Since the beginning of this decade (2010s), small business produced 71% of all new jobs.  Today small business employs 77% of the US labor force (see: Jobenomics Employment Report-August-2013).

Jobenomics also believes that a national initiative involving small, emerging and self-employed business creation would be an insurance policy against future economic downturns.  The creation of 20 million new jobs via small businesses—the engine of the US economy—would mitigate potential reduction of 20 million jobs as calculated above.

 Total New US Jobs By Decade

In the 1970s, 1980s and 1990s, the US created an average of 20 million new jobs each decade and can do so again. However, this amount of growth will not transpire using traditional methods.  Jobenomics believes that America needs to focus a model based on sustainability and self-sufficiency enabled by emerging information technologies and an improved national info-structure.  Jobenomics advocates a transition from dependency on large urban institutions to more independent small rural and virtual business networks.  This does mean that we abandon our current model but supplement it with alternatives that have the highest probability for scalability and growth.

Jobenomics is working on three highly-scalable, small business initiatives that could create millions of new jobs.  These initiatives include:  (1) a national effort for Generation Y to monetize social networks via a modernized info-structure, (2) a national direct-care effort to accommodate the aging and children via substantially increasing the number of women-owned businesses, and (3) a national effort to monetize waste streams via waste-to-energy and waste-to-raw materials that could rejuvenate depressed inner cities and the financially disadvantaged.

These three fledging initiatives are representative of the efforts of several hundred dedicated individuals—imagine what our nation could do writ-large.


[1] The Sourcebook for Teaching Science – Strategies, Activities, and Instructional Resources, Television Statistics, IV. Commercialism, http://www.csun.edu/science/health/docs/tv&health.html

[2] World Bank, Household final consumption expenditure, etc. (% of GDP), http://data.worldbank.org/indicator/NE.CON.PETC.ZS

[3] Federal Reserve, Flow of Funds Accounts of the United States, 2007-2013 Q1,  Table F.6 Distribution of Gross Domestic Product, Page 12, 6 Jun 2013, http://www.federalreserve.gov/releases/z1/Current/z1.pdf

[4] US Department of Commerce, Bureau of Economic Analysis, Table 2.3.5U Personal Consumption Expenditures by Major Type of Product and by Major Function, 7 August 2013, http://www.bea.gov/itable/iTable.cfm?ReqID=12&step=1#reqid=12&step=3&isuri=1&1203=14

[5] US Department of Commerce, Bureau of Economic Analysis, Table 2.5.5 Personal Consumption Expenditures by Function, 7 August 2013, http://www.bea.gov/iTable/iTable.cfm?reqid=9&step=3&isuri=1&903=69#reqid=9&step=3&isuri=1&910=X&911=0&903=74&904=2004&905=1000&906=Q

[6] American Bankruptcy Institute, Annual Business and Non-business Filings by Year (1980-2012), Year 2012, http://www.abiworld.org/AM/AMTemplate.cfm?Section=Home&CONTENTID=66471&TEMPLATE=/CM/ContentDisplay.cfm

Stock Markets and The Fed

Download PDF Version: Stock Market and The Fed 1 July 2013

1 July 2013

US stock market performance has been phenomenal since the depths of the Great Recession.  Since March 2009, all three major US indices (Dow Jones, S&P 500 and NASDAQ) have experienced a 4 ½ year bull market as shown below—up as high as 163%.

Stock Market Performance

The big questions facing economists, policy-makers, opinion-leaders and investors are whether (1) this bull market will continue, (2) can the stock markets operate under their own power, and (3) how chaotic will the markets become during tapering of US government subsidies to big business? To answer these questions, one must first consider the level of involvement of the US government, especially the actions of the US Federal Reserve Board—the single most important government agency in relation to stock markets.

The US Federal Reserve System’s, also known as the Federal Reserve or simply the Fed, engagement on monetary and credit policy has immediate consequences for financial institutions, investors and economic recovery.  After 4 ½ year’s of aggressive engagement via printing money, buying securities and manipulating interest rates, an increasing number of investors fear that disengagement by the Fed may have dire consequences regarding the attractiveness of stocks vis-à-vis other investment opportunities, such as commodities, bonds or even cash.  Moreover, many economists fear that stock market has been artificially inflated by government involvement and any tapering by the Fed likely to cause the stock market bubble to deflate, or burst, not only in the US but in fragile economies in Europe and Japan.  Finally, policy-makers and strategic planners are worried that adverse consequences created by Fed cutbacks will have a domino effect on the global geo-political/economic balance of power.

 USG Financial Bailouts to Private Sector

The US government has been stimulating publically-traded financial institutions and corporations to the tune of $16.6 trillion since 2008.  Federal Reserve programs totaled $10.9 trillion, mostly for banks, financial institutions, insurance companies and government sponsored enterprises (Fannie Mae and Freddie Mac—holders of 77% of all American mortgages).  US Treasury programs totaled $2.9 trillion, mostly to individuals and the auto industry.  Federal Deposit Insurance Corporation (FDIC) totaled $2.5 trillion, mostly for local banks. The US Department of Housing and Urban Development (HUD) totaled $306 million, mostly for homeowners via the Federal Housing Administration.  Since the Federal Reserve is responsible for 66% ($10.9 trillion out of $16.6 trillion), it has been the most influential organization in regard to the US economic recovery as well as  4 ½ year bull stock market run.  Consequently, it is important to understand the role of the Fed and its actions in order to anticipate the future of the US stock markets.

The US Federal Reserve System is the central banking system of the United States.  The Fed is both the US government’s bank and the bankers’ bank.  As an independent institution, the Federal Reserve System has the authority to act on its own without prior approval from Congress or the President.  The Fed was created by Congress to be self-financed and is not subject to the congressional budgetary process. In this way, the Fed is considered to be “independent within government.”

The Federal Reserve System has a number of layers.  The top layer is the 7-member Board of Governors, who are appointed by the President and confirmed by the US Senate.  Ben Bernanke is the current Chairman of the Board whose term expires on 31 January 2014.  The second layer is comprised of 12 regional Federal Reserve Bank districts, each with a board of nine directors, 3 of whom are appointed by the Fed’s Board of Governors and 6 are elected by commercial banks in the district.  The third layer consists of approximately 4,900 member banks that are private institutions (mainly national and state-chartered banks). Each member bank is required to subscribe to non-tradable stock in its regional Federal Reserve Bank, entitling them to receive a 6% annual dividend.  While not officially part of the Fed, the Federal Deposit Insurance Corporation is a sister institution with 9,500 members.  The FDIC-insured lending institutions comprise the vast majority of all bank deposits in the US.  A very small number of small banks are neither an FDIC nor a Fed-member bank.

The primary responsibility of the Fed is the formulation of monetary and credit policy in pursuit of maximum employment, stable prices, moderate long-term interest rates, and economic growth.  The Fed normally accomplishes this by setting interest rates, controlling the money supply by printing money and trading government securities, and regulating the amount of reserves held by banks.

 Federal Reserve Funds (Interest) Rate

One of the first actions that the Fed initiated was lowering interest rates to almost zero to simulate the economy.  As shown above, the Fed lowered the Federal Fund Rate to near-zero prior the end of the recession—the lowest rate in 60 years.  Today, four and half years later, this rate remains at near-zero (0.11%).  To understand the role that the Federal Funds Rate plays in the banking system, one must first understand the four layers of interest.

  • Federal Funds Rate.  The federal funds rate (currently 0.11%) is the rate of interest at which federal funds are traded among banks, pegged by the Federal Reserve through its Open Market Operations.
  • Federal Reserve Discount Rate.  The discount rate (currently 0.75%) is the rate that the Fed charges its depository banks and thrifts who need to borrow money from the Fed.  The Fed directly sets the discount rate based on the economic/monetary policy it wants to achieve, as well as the underlying rates that banks charge one another.
  • Prime Rate.  The prime rate (currently 3.25%) is the interest rate offered by banks to their most valued customers.  The prime rate is based on the discount rate.
  • Bank Rate. Most consumers are familiar with the interest at their local bank when they apply for a mortgage, auto or other loan.  The bank rate (currently 4% to 6%) is based on the prime rate.

Consequently, the Federal Funds Rate sets the baseline interest rate that all other rates are based upon.   Since virtually every US bank sets its rates on underlying Fed rates, the magnitude of the Fed’s near-zero rate policy is profound.   Unfortunately this near-zero rate has not produced a robust US economic recovery as anticipated.  While stocks and corporate profits have soared, GDP growth, employment and lending have languished with dire impact on the American middle class.

When a near-zero Federal Funds Rate does not achieve the desired monetary effect (stimulating economic growth), the Fed turns to other measures since they are not able to reduce interest rates below zero.   Normally, the Fed stays out of the private sector, but these are not normal times.  As a result of the 2008-09 economic crisis, the Fed was compelled to enter the private sector in essentially three ways:

  • Printing money to increase liquidity to increase lending by banks,
  • Rescuing too-big-to-fail financial institutions, and
  • Buying mortgage-backed securities that are toxic to banks, major financial institutions and insurance companies.

After September 2008, the Fed launched a massive liquidity effort by pouring trillions of dollars in short-term lending into financial firms and corporations.  A host of new programs was created, including repurchase agreements, term auction credits, commercial paper funding facility, liquidity swaps and various other loans and bailouts.  This liquidity effort was designed to be temporary in nature with a minimum risk to inflation.  The liquidity effort worked.  It saved a number of banks and corporations (such as the automotive industry) from insolvency without creating inflation.  This liquidity, coupled with near-zero interest rates, has also found its way into the US stock markets, which have now recovered their losses since the Great Recession.

 Federal Reserve Balance Sheet

Since 2008 to today, the Fed has purchased approximately $3.5 trillion in toxic financial instruments from the private sector.  In essence, the Fed is now carrying the bad debt that formerly resided on the balance sheets of major financial institutions and corporations.

The Fed also launched an aggressive asset purchase program, called quantitative easing or QE.  Quantitative easing involves buying securities, which increases the money supply, which promotes increased liquidity and lending.  Over time, the Fed’s purchases of these assets was supposed to promote new business investment that, in turn, would bolster economic activity, create new jobs, and reduce the unemployment rate.  While QE has bolstered the stock markets, it has done little for business investment or unemployment.

 Effects of Feds Stimulating S&P500

The effect of the Fed’s quantitative easing programs can be seen on the performance of the S&P 500 stock market, which is comprised of America’s top 500 publically-traded companies.  As shown on the graph above, every time the Fed initiated a quantitative easing program the S&P 500 grew significantly.   The opposite effect happened when the quantitative easing programs ended—the markets declined. The same effects happened with other US and foreign stock markets.

  • QE1 (Quantitative Easing #1) occurred between December 2008 and March 2010 and involved a total of $1.75 trillion dollars worth of purchases of toxic mortgage-backed securities ($1.25 trillion) and debt ($200 billion) from Fannie Mae, Freddie Mac, Ginnie Mae and the Federal Home Loan Banks, and $300 billion of long-term Treasury securities. The main purpose was to support the housing market, which was devastated by the subprime mortgage crisis.
  • QE2 (Quantitative Easing #2) occurred between November 2010 and June 2011 and involved $600 billion dollars worth of purchases of long-term Treasuries at a rate of $75 billion per month.  Treasuries include treasury bonds, notes, and bills. The Fed buys treasury securities when it wants to increase the flow of money and credit, and sells when it wants to reduce the flow.  In essence, after the Fed purchases treasury securities, it adds a credit to member banks, which increases the amount of money in the banking system and ultimately stimulates the economy by increasing business and consumer spending because banks have more money to lend at lowered interest rates.
  • QT1/2 (Operation Twist #1 & #2) occurred between September 2011 to December 2012 and involved a total of $667 billion.  Operation Twist was a plan to purchase bonds with maturities of 6 to 30 years and to sell bonds with maturities less than 3 years, which pressured the long-term bond yields downward and extended the average maturity of the Fed’s own portfolio.
  • QE3/4 (Quantitative Easing #3/#4) started in September 2012 and continues today open-ended until the economy recovers and the official employment rate drops below 7%.  QE3 provided for an open-ended commitment to purchase $40 billion agency mortgage-backed securities per month until the labor market improves “substantially”.  QE4 authorized up to $40 billion worth of agency mortgage-backed securities per month, and $45 billion worth of longer-term Treasury securities.

 DOW versus Fed Assets

This graph shows the relationship between the Dow Jones Industrial Average (top 30 US publically-traded companies) and the Federal Reserve’s balance sheet.  The Fed’s purchase of toxic mortgage-backed securities from the private sector and Treasuries has bolstered stock markets worldwide, as well boosting US corporate profits to an all-time high as shown below.

 Corporate Taxes After Tax

Corporate profitability can be directly tied to the Fed’s involvement.  First, low interest rates encouraged investors to buys stocks as opposed to traditional investments like savings accounts, certificates of deposits (CDs) and money market accounts since their rate of return was low due to low Federal rates.  Secondly, corporate bonds (even those rated as junk bonds status) offering meager dividends (compared to savings, CDs and money markets) sold briskly allowing corporations to build up their cash reserves and profitability.  Rather than hiring or recapitalizing, many corporations used this cash for mergers, acquisitions and buy-backs of their own shares that increased their own net worth as well as their investors.  In most cases, these corporate actions were wise financially.  Corporate officials knew that the “era of easy money” stimulated by the Fed would eventually end, and building up cash reserves was fiscally responsible until the US economy showed real signs of recovery, which has not happened.

 Corporate Profits After Tax vrs Money in Circulation

What do we mean by the “era of easy money”?  The above chart is an exploded view of corporate profitability from 2008 to today (April 2013) that is overlaid by money in circulation that is controlled by the Fed.  During the period, corporate profits rose by $1.1 trillion versus a $2.2 trillion rise in money in circulation.  While rising about half the rate of the money supply, corporate profits generally followed the same upward path.  This generous supply of easy money allowed corporations to borrow at low interest rates for mergers, acquisitions and buy-backs.  In addition, easy money depressed the value of the US dollar relative to other currencies, which made US exports (the domain of big business) more competitive.

The old adage “make hay while the sun shines” is applicable to corporations and their investors in the stock markets.  The Fed Chairman has recently indicated that the era of low interest rates, excessive borrowing and quantitative easing are about to end.  In other words, the era of easy money is about over and the markets will have to operate with less and less government subsidies.  It is clear that the stock markets are addicted to these subsidies and are adverse to any withdrawal.    On 20 June 2013, the Dow Jones and the S&P 500 had their biggest point losses in more than a year and a half after Federal Reserve Chairman Ben Bernanke hinted that the Fed could begin dialing back its economic stimulus later this year.  After 4 1/2 years of Fed’s quantitative easing levitating stock markets and low interest rates, many investors are terrified by the prospect of market chaos without the underwriting of the Fed.

The probability of market chaos is a given.  However, there are two views.  The view that is held by most economists, policy-makers and opinion-leaders is that the markets will undergo a period of turbulence but will recover due to structural soundness and historical precedent.  Jobenomics takes the opposite view.  Jobenomics asserts that the US economy is structurally flawed because Americans, from Wall Street to Main Street, shifted emphasis from manufacturing and producing to investing and speculating over the last three decades.   Three decades ago, the US was the largest creditor nation in the world and commanded the lion’s share of global GDP.  Today, we are the largest creditor nation in the world and our share of GDP has diminished significantly—largely due emerging economies like China.   Jobenomics also asserts that the $16.6 trillion spent by the federal government was not well spent as evidenced by the low rate of US GDP growth, high unemployment, exponential growth of people leaving the US labor force, our dwindling middle class, and a hundred million US citizens dependent on government handouts and welfare payments.

To grow an economy, a nation needs three essential factors: (1) sound monetary policy, (2) sound fiscal policy, and (3) private sector growth.  The Fed is responsible for monetary policy.  Under Chairman Bernanke’s leadership, the Fed has done an admirable job by keeping our economy from going over the proverbial fiscal cliff.  However, the Fed cannot produce economic growth, it can only stimulate and incentivize.  Congress is responsible for fiscal policy.  Their failure to resolve debts and deficits, taxation and budgeting, as well as a host of other economic and employment issues are major obstacles to economic growth.  Private sector businesses are ultimately responsible for economic growth.  Unfortunately in this era of big government, private sector businesses have suffered.  Moreover, many Americans and politicians view businesses as a necessary evil or as a check book for social programs.  Until these negative attitudes change, American economic recovery will be tentative at best.

Jobenomics believes that the best prescription for economic prosperity lies with small business creation with emphasis on startup, emerging and self-employed businesses.

 US Jobs Created This Decade by Company Size

Since the beginning of this decade, small business produced 71% of all new jobs.  This is an amazing statistic considering the adverse lending environment by financial institutions, mounting government regulation, and the pittance of federal government spending on small businesses.  Equally important, is the lack of commercial lending to very small and startup businesses that have been starved for capital.  Very small and startup businesses have traditionally been the primary source of employment for entry-level workers and the long-term unemployed.  Had the US government paid more attention to small business rather than providing generous subsidies to big business, Jobenomics estimates that ten million more Americans would be employed today if government focused on key next-generation business initiatives.   Jobenomics is working on three next-generation business initiatives that could potentially ten million new jobs.  These initiatives include:  (1) a national effort for Generation Y to monetize social networks via a modernized info-structure, (2) a national direct-care effort to accommodate the aging and children via substantially increasing the number of women-owned businesses, and (3) a national effort to monetize waste streams via waste-to-energy and waste-to-raw materials that could rejuvenate depressed inner cities and the financially disadvantaged.

In conclusion, stock market success may be more of an illusion than reality.  At some point in time, US federal government subsidies to financial institutions and corporations will end.  When that time happens, we will find out if the markets can operate under their own power.   Until then, America needs to diversify its investment strategy starting with small business, the engine of the US economy. Now is an ideal time to implement a new investment strategy to replace the old one that Chairman Bernanke says is about to end.


Nation of Shopkeepers

The epithet “Nation of Shopkeepers” was used by Napoleon to infer that a British merchant society was incapable of effectively waging war against the mighty nation of France.  Napoleon was wrong.   British merchants and industry provided the resources that enabled England, with half the population of France, to win the Napoleonic Wars.

The phrase, “Nation of Shopkeepers”, did not originate with Napoleon. It first appeared in The Wealth of Nations by Adam Smith in 1776.   Smith believed that when individuals pursue their self-interest, they indirectly promote the greater good of society. He argued that merchants, seeking their own self-interests, contribute significantly to the commonwealth by producing vital goods, services and tax revenues.  Without this “invisible hand”, societies would be incapable of effectively pursuing self-sufficiency, prosperity and wealth creation.

Recent articles in prestigious publications, like USA Today and The Economist, make similar claims that a nation of small businesses cannot compete in the global marketplace because:

  • Big is better.  Big firms employ more, are more productive, can reap economies of scale, can focus resources on innovation, offer higher wages, and pay more taxes.
  • Smaller means weaker.  Small businesses fail at greater rate than big businesses.    Small businesses are not particularly adept at creating jobs, at least not the best jobs.  Almost all the 6 million companies in the US are small businesses, with fewer than 500 workers.  Most small business owners just want to be their own boss and never expect to hire more than a few employees.

Like Napoleon’s premise that a nation of shopkeepers cannot compete, those that believe that a nation of small businesses cannot compete are simply wrong.  Small business is America’s economic backbone—producing $6 trillion worth of annual products and services and employing half of the American private sector work force.  Moreover, it is small business, not big business, which is the foundation of job creation.  Since the beginning of this decade, small business generated 95% of all new American jobs (see: Employment Scoreboard: March 2012).  As far as innovation, the Small Business Administration (SBA) reports that small business produce 16.5 times more patents per employee than large firms.

There are not 6 million small businesses in the US.  There are 27.3 million small businesses.   The latest available Census data show that there were 5.9 million firms with employees and 21.4 million without employees in 2008. These 27 million small businesses pay 43% of total US private payroll and are responsible for 97.5% of all identified exporters with 31% of export value as reported by the SBA Office of Advocacy.  Just as important small businesses do not export jobs like big businesses.

The perception that small businesses regularly fail is only partly true.  While the failure rate is high, so is their entrance rate.  A recent landmark Census Bureau study showed that small establishments are no more inclined to exit business than large businesses.   This misperception exists because of the high exit rate of micro-firms (1-4 employees), which averaged 18.4% over the last three decades.  While this rate was high, their entry rate was even higher at 21.3%, therefore producing a net gain of 2.9% over the period.  The entry/exit rate difference for all firms was only 1.9%.  Looking at this data from a different perspective, compared to all businesses, micro-firms were more likely to succeed, which is counter-intuitive to common perception.

More recent data, reported by the ADP National Employment Survey, shows that very small businesses with 1-49 employees grew +7% over the last dozen years, whereas small businesses with 50-499 employees and medium/large businesses with more than 499 employees lost -4% and -16% respectively over the same period of time.

According to a recent Kauffman Foundation Study, job growth in the US is driven entirely by startups.  The study reveals that, both on average and for all but seven years between 1977 and 2005, existing firms are net job destroyers, losing one million jobs net combined per year.   By contrast, in their first year, new firms add an average of three million jobs.  According to the Kauffman Foundation, “Policymakers tend to focus on changes in the national or state unemployment rate, or on layoffs by existing companies. But the data from this report suggest that growth would be best boosted by supporting startup firms.”

From a Jobenomics perspective the government’s primary jobs creation role is to create an environment where small, entrepreneurial businesses can flourish.  Unfortunately, government officials are locked in a mindset that a nation of “shopkeepers” cannot compete and the solution to growing the economy is a combination of big business and government. Perhaps the greatest factor contributing to this mindset is the scarcity of business owners working in government.  Furthermore, entrepreneurs and serial-entrepreneurs are almost completely absent in government decision-making.

Bureaucrats tend to view risk as a liability, whereas entrepreneurs embrace risk as an opportunity.  Serial entrepreneurs embrace multiple ideas, get companies started, and transfer leadership to operational managers so they can move on to new ventures.  Steve Jobs is an example of a serial-entrepreneur who created multiple iconic businesses.  Our country is blessed with tens of thousands of proven serial entrepreneurs.  Unfortunately, few serial-entrepreneurs serve on government economic councils that are replete with politically-correct and process-driven corporate chieftains and economists.

If small business is America’s economic engine, and if entrepreneurs and innovators are essential to business startups, then how does America change the government mindset?  The upcoming presidential election debates are a good place to start.

From a Jobenomics point-of-view, neither the President nor the leading Republican candidates have yet articulated a viable jobs creation strategy.  Virtually all of the proposed job creation plans are top-down political agendas oriented to ideologically-driven constituencies.  Almost every political speech contains references to a reformed regulatory environment, better tax incentives and cuts, debt and deficit reduction, helping the middle-class, importance of small business, revitalized manufacturing, green jobs, environment protection, energy independence, stimulation packages, tort reform, reciprocal trade agreements, and increased exports as ways to increase jobs.  While all of these areas are necessary, they are insufficient.

Political focus has to be on business creation, not job creation.  In recent years, small, emerging and self-employed businesses have been responsible for virtually all of America’s new jobs.   Yes small businesses fail, but enough survive to prosper our society.   Seven out of ten startup firms survive at least 2 years, half at least 5 years, a third at least 10 years, and a quarter stay in business 15 years or more.  From an entrepreneurial perspective, these are very lucrative statistics that should be the bedrock for a national business initiative to create millions, or tens of millions, of new small and self-employed businesses by year 2020.

A nation of small businesses empowered by 21st technology can compete globally in ways never before thought possible.  It is almost inconceivable that today half of America’s GDP is generated by 27 million small businesses.   It is equally inconceivable that 52% of these businesses are home-based.  Jobenomics envisions that the American labor force will continue to be transformed by small, largely self-employed, home-based businesses. This transformation will be lead by 70 million members of America’s millennial generation who will monetize the internet and social networks in ways not yet conceived.  The country that learns how to monetize social networks, like Facebook with 825 million users, will be transformed almost overnight.  Tens of millions of new businesses (mostly small and self-employed) will be created.

American innovation, ingenuity and entrepreneurship are the keys to a prosperous future where everyone who wants to work can find a job.  A national small business initiative starts with an achievable vision.  President Kennedy focused American science and technology on getting to the moon in a decade.  In comparison, the Jobenomics 20 million new private sector jobs by year 2020 (20 by 20) goal should be very achievable.  If China can lift 400 million peasants out of poverty in two decades, America can create 20 million new private sector jobs in one decade. Adding millions of new “shopkeepers” to a nation that is already of nation of small businesses could boost our commonwealth to new economic heights.


Women-Owned Businesses

From a Jobenomics perspective, women are the greatest untapped asset in
America.  The women-owned business initiative is paramount in the Jobenomics 20 million new private sector jobs by the year 2020 campaign (20 by 20).

Jobenomics’ emphasis is on women-owned businesses, as opposed to women-in-business.  The US has approximately 18,000 big businesses, 6 million small businesses, and 22 million self-employed businesses.  While there is nothing wrong with women pursuing opportunities in big business, Jobenomics believes that most women will find greater opportunity and satisfaction by creating their own small, self-employed business, tailored to their individual lifestyles. In comparison, today’s highly competitive corporate workspace tends to require employees to conform to corporate culture, which can conflict with other roles women may juggle, such as caring for children or aging parents.

The 2010’s is certain to be the Decade of Women-owned businesses. (1) The Great Recession has encouraged many women to join the workforce, due to necessity or desire, of which many are college educated. (2) Male-dominated industries, like construction and manufacturing, aren’t likely to return to normal until the end of the decade. (3) Social norms are changing, allowing greater participation of women in business. (4) Many of the future service-related jobs, like elder-care, are likely to be dominated by women. (5) Women-owned businesses emphasize small businesses, rather than large, and are more likely to experience growth in the next decade. (6) The traditional “nuclear” families, with a male-head of household, have given way to households headed by women. (7) Most importantly, the rate of employment growth and revenue of women-owned businesses has outpaced the economy and male-dominated businesses for the last three decades.

Today, there are approximately 10 million women-owned businesses that employ 23 million direct and indirect employees, or 22% of the US private sector civilian workforce.  9 million women-owned firms are self-employed businesses without employees.  If each women-owned business hires one additional person this decade, 10 million new jobs would be produced.  This would equate to 10 million direct jobs—half the 20 by 20 goal.  The jobenomics effort intends to help create the conditions that will motivate and incentivize growth of women-owned firms.

Jobenomics is working with several leading women’s organizations (Women’s Information Network, Women’s Radio, and California Leading Ladies) to help define women-owned business initiatives in areas like direct-selling, direct-care, cloud computing, and women veterans’ small businesses.  The Jobenomics Community-Based Business Generators will feature a number of programs that will facilitate creation of women-owned businesses.

The Women’s Information Network: http://thewinonline.com

Women’s Radio:  http://www.womensradio.com

California Leading Ladies: http://www.leadingladiesconference.com & www.EventComplete.com