Consumption-Based Economy

Download PDF Version: Consumption-Based Economy 2 Sep 2013

2 September 2013

The USA is a consumption-based economy and America is a consumption-driven society.  Neither fact is necessarily good or bad.  It is the way America has operated for a century.  The issues at hand are (1) whether America can sustain high rates of consumption in an ever changing geo-political/economic environment, and (2) what are the consequences of a reduced consumption-based economy?

Consumption is an economic function that is defined as the value of all goods and services bought by people.   Leading economists determine the performance of a country in terms of consumption level and consumer dynamics.  The underlying theory of a consumption-based economy is that progressively greater consumption of goods is economically beneficial.   Jobenomics believes that this theory is only partly true.  Production, not consumption, is the true source of wealth.  Production uses resources to create goods and services that are suitable for use or exchange in a market economy.   If America wants a healthy economy, we need to create the conditions under which producers (businesses as opposed to governments) can accelerate the process of creating wealth for others to consume and finance future production.

To better understand the dynamics of our consumption-based economy, let’s first examine US consumption statistics, and then address consumption-based economy sustainability, potential consequences of reduced consumption, and Jobenomics recommendations.


US Consumption Statistics.   The US is consumption-based society where spending and consumption of goods and services are essential to economic health.   In America’s pre-consumer era, the US economy was based on agriculture and cottage industries where citizens produced what they needed and traded the rest.  Non essential consumption was largely the privilege of an elite few.  Over the last century, consumerism was introduced to the masses as part of the American economic equation.  Today, consumption is no longer a privilege but a necessity.  Increased consumption is necessary to keep the economy growing.  Without increased consumption, the economy would falter.

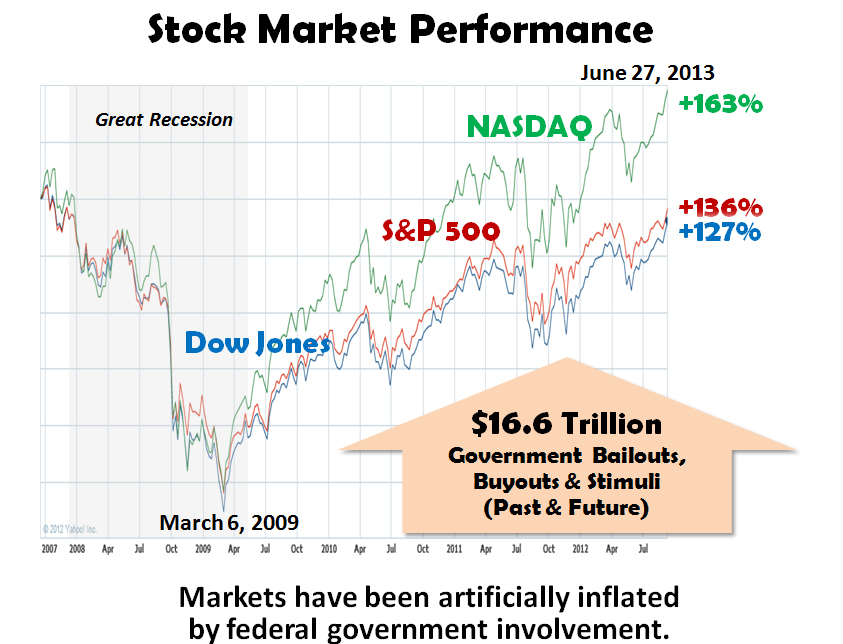
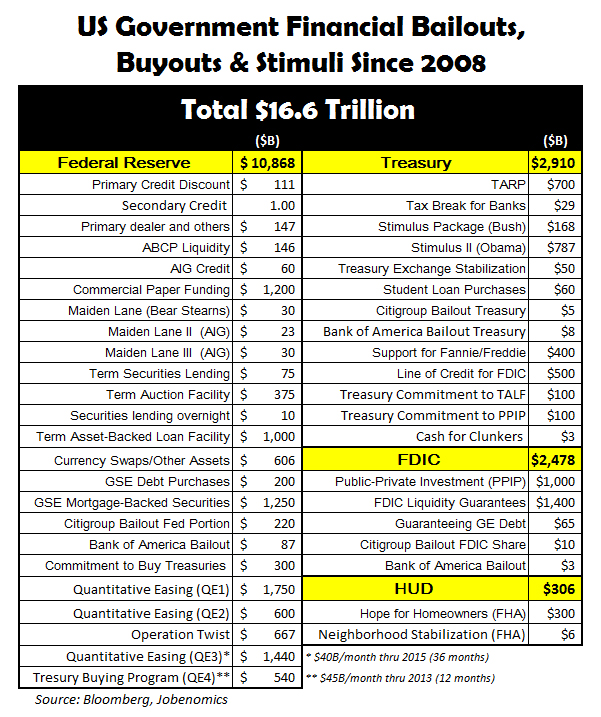
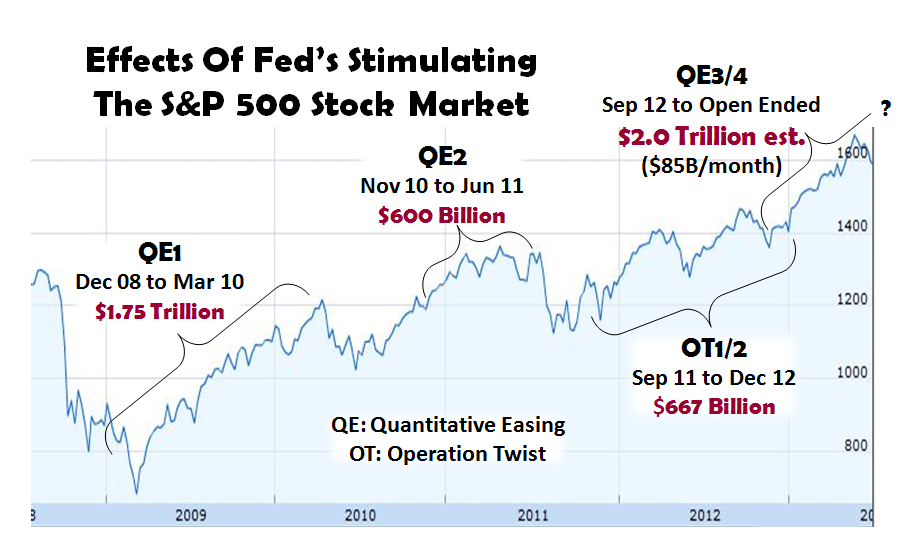
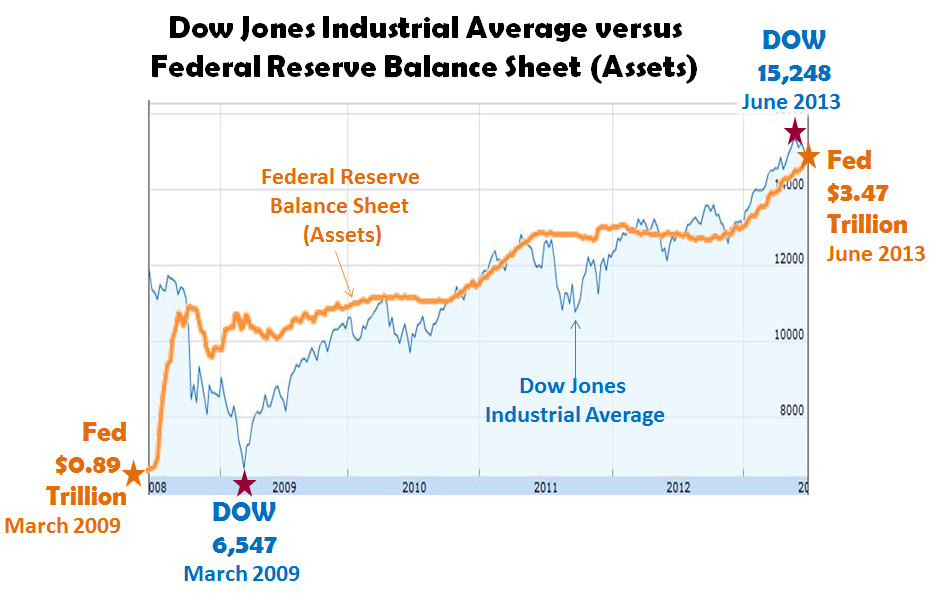
To sustain a growing economy, government, financial institutions and corporations must motivate citizens to keep consuming to preserve our way of life.  Modern-day Americans are programmed to be good consumers.    It is estimated[1] that an average American child watches 20,000 TV commercials per year.  By age 65, the average American watches 2 million commercials.  We are programmed for mega-consumption for special occasions, like Christmas that evokes $80 billion worth of gift-giving.  When an event, like 9/11 or the Great Recession of 2008-09, happens the federal government steps in to encourage consumption.  The Monday following the 9/11 Trade Tower attacks, the White House encouraged American’s to continue shopping due to fears that Wall Street would falter if consumer confidence plummeted.  At the advent of the Great Recession, the federal government implemented a series of bailouts, buyouts and stimuli to keep financial institutions and corporations afloat in order to stimulate our consumption-based economy.  These federal stimuli continue today to the tune of $16.6 trillion (see http://jobenomicsblog.com/stock-markets-and-the-fed), which is in addition to the $3.5 trillion spent annually for federal goods and services.

 International Comparison of Consumption as a Percent of GDP

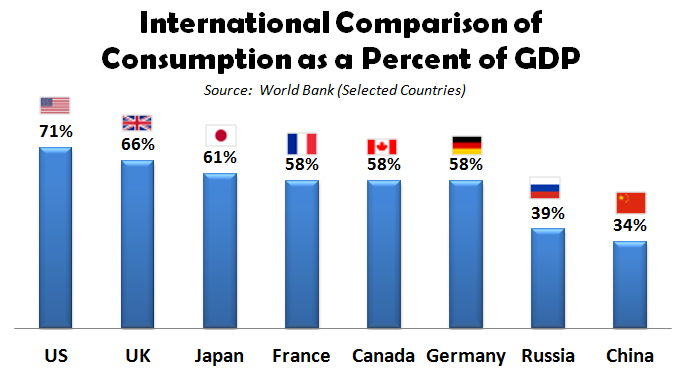
According to The World Bank[2], the United States is the largest and most conspicuous consumption-based economy in the world.   As shown, the US leads the world with 71% consumption as a percent of US gross domestic product (GDP, the sum of all goods and services produced in the US by Americans).  Other Western economies average about 60%.  Emerging economies average around 35%.

China, as true with many developing countries, depends on government-funded investment to encourage economic expansion.    Chinese household consumption expenditure is 34% where government investment is approximately 54%.  Most of this government investment comes from the Chinese government to large state-owned corporations that are granted easy access to capital for development of factories, real estate and infrastructure.

 Personal Consumption Expenditures as a Percent of US GDP-3

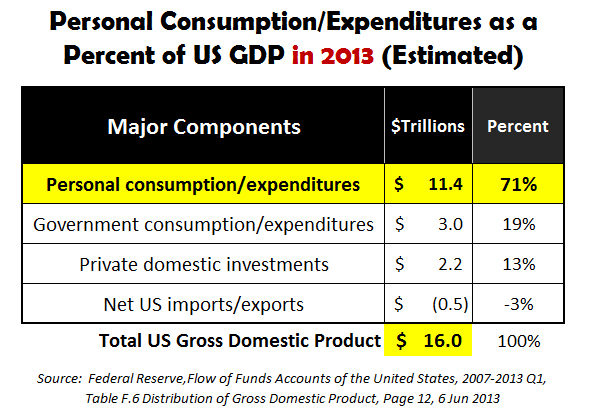
The overwhelming percentage of GDP is generated by personal consumption and expenditures as shown above.  The US Federal Reserve System (the central bank of the United States) reports monthly[3] on the various components US GDP.  For 2013, personal consumption and expenditures amounts to $11.4 trillion out of a total GDP of $16.0 trillion, or 71% of the total.  Government consumption, expenditures and investments amount to $3.0 trillion, or 20% of the total.  Private domestic investment (mainly businesses and real estate investments) accounts for $2.2 trillion, or 13%.  The final component is net US imports/exports, which is a negative $500 billion (-4%) since foreign imports exceed US overseas exports in our consumption-based economy.

 Personal Consumption Expenditures as a Percent of US GDP by Decade

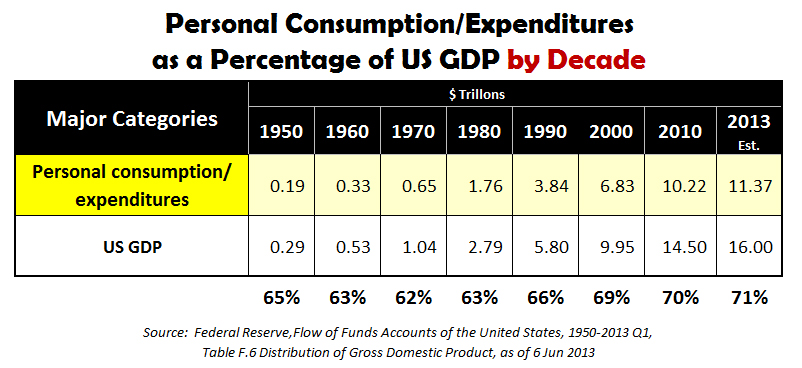
US personal consumption rose over the last seven decades as a percentage of US GDP—ranging from a low of 62% to a high of 71% today.   It is interesting to note that the two recessions in the decade of the 2000s did not decrease the ever growing amount of consumer spending.

 Personal Consumption Expenditures by Major Product Type

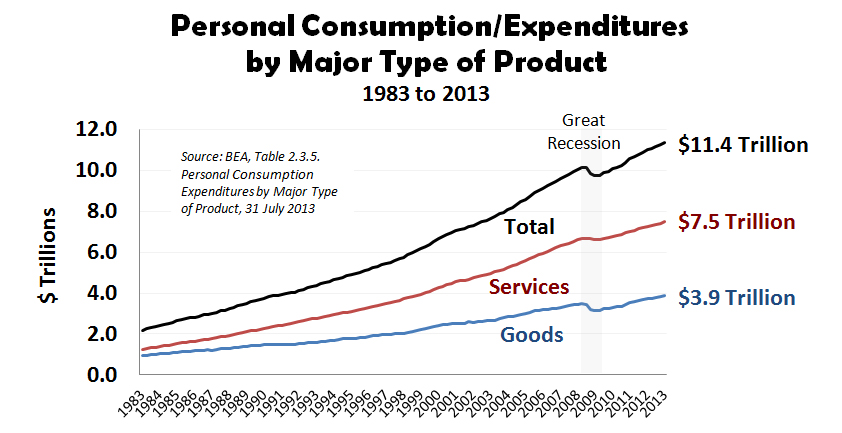
As estimated by the US Bureau of Economic Analysis[4], personal consumer spending has reached an all time high of $11.4 trillion in year 2013.  From 1959 (earliest BEA records) to 1970, consumption of goods exceeded services.   After 1970, services rapidly exceeded goods.  Today, the US consumes $7.5 trillion worth of services and $3.9 trillion worth of goods.   In other words, the US is a services-oriented, consumption-based society by a factor of almost 2 to 1.

 What Americans Buy and Consume

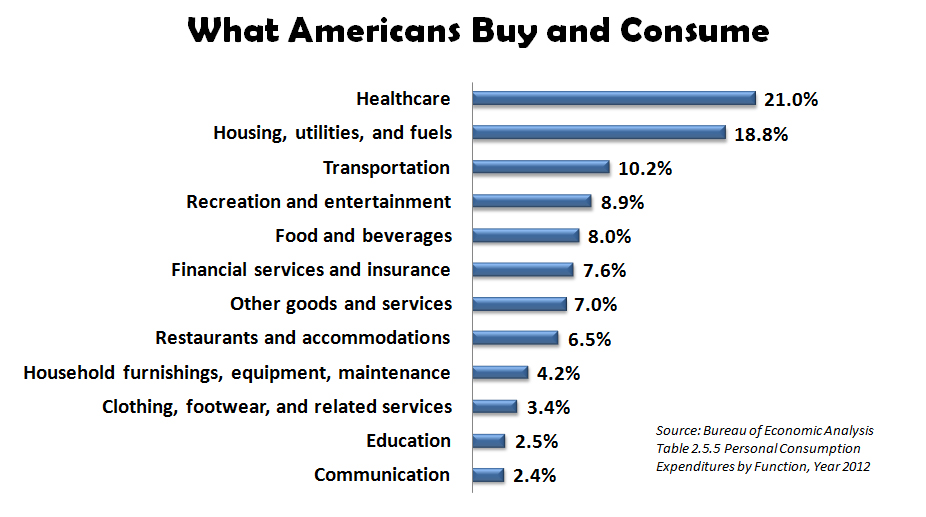
Americans consume a vast variety of goods and services[5] with healthcare (21.0%), housing (18.8%) and recreation/entertainment (10.2%) topping the list.   Surprisingly, Americans spend more on entertaining themselves (recreation and entertainment, 8.9%) than they do on groceries (food and beverages, 8%)—a sign of “conspicuous consumption”.

Conspicuous consumption is generally defined as spending on goods and services mainly for the purpose of displaying income, wealth or social status.  Consumers naturally want the latest gizmos and to keep up with the “Jones”.  However, advertising, easy money (credit) and federal stimuli encourage consumption practices that far outstrip our ability to pay.  It is this inability to pay—both in government and the private sectors—that puts the American economy at risk.

America has a consumption conundrum.   On one hand, the US economy is dominated by consumption (71%) that must be maintained in order for the economy to prosper.  On the other hand, conspicuous, unneeded or unessential consumption without the ability to repay spiraling indebtedness risks defaults, ever higher interest rates, and bankruptcy.  Approximately 50,000 businesses and 1 million individuals file for bankruptcy each year[6].  Bankruptcies in major cities, like Stockton, Harrisburg and Detroit, indicate that something is amiss.


Consumption-Based Economy Sustainability.  Is our consumption-based economy sustainable?  Jobenomics assesses the short-term outlook as favorable and the long-term outlook as unfavorable.  However, the long-term outlook could be favorable if the American populace and their elected leaders exploit the advantages of the US labor force and solve a number of significant challenges facing US economic growth.

Americans have a number of advantages in regard to the global economy.  Primary advantages include inertia, innovation, adaptability, natural resources, and the dollar as the world’s currency—all of which will sustain the US economy in the short-term.

  • In physics, inertia is defined as a property of matter to retain its momentum in the absence of an external force.  The same is true of our consumption-based economy that has retained momentum over the last five decades as shown on the 1959 to 2012 Personal Consumption/Expenditures by Major Types of Product  chart .  Even the Great Recession of 2008-2009 caused only a temporary speed-bump in US personal consumption expenditures.  Even with all its challenges, the US economy is still the largest, most vibrant and the most stable in the world.
  • Innovation is part of the American fabric.  Historically, Americans have been the first to embrace disruptive technologies that transform life, business and the global economy.  US innovators and entrepreneurs have revolutionized our society many times in the last century from the military-technological revolution in the 1950s/60s, to the information-technology revolution in the 1980s/90s and todays energy-technology revolution.
  • Americans adapt to change.  Within the last 200 years, Americans transitioned from: pre-consumer to consumption-based, agriculturally-based to industrial-based, industrially-based to information technology-based, from dependence on goods to services, as well as rural to urban.   In 1810, only 6.1% of Americans lived in cities.  By 1910, 45.6% lived in cities.  Today, 80.7% of all Americans live are urbanites.
  • Unlike most countries, America has ample resources.  The most important resource is human.  When we run short of human resources, America has been able to attract and retain foreign talent.  The second most important resources is natural.  We have abundant supply of arable land, water and energy.  Our challenge is to husband these resources in an economically and environmentally balanced way.
  • The dollar is the world’s reserve currency. While there is a lot of talk about replacing the dollar with a new form of global currency based on a “basket” of currencies or commodities, the dollar should remain the world’s currency in near future.  Being the world’s reserve currency, allows the US federal government to print and borrow money to manage its cash flow needs.  This is not true of almost any other country on earth.


However, America has a number of significant challenges to include debt/deficits, fiscal/monetary policy, financial disruptions and demographics that could upend our consumption-based economy.

  • The US is now the greatest debtor nation in the world.  Over-consumption caused US private and public debt (the total of all US government, households, corporations and financial institutions) to surge upward to $45 trillion, or 300% of US GDP.  Eventually these debts will be reconciled via dollar devaluation, increased interest payments, defaults or high inflation.
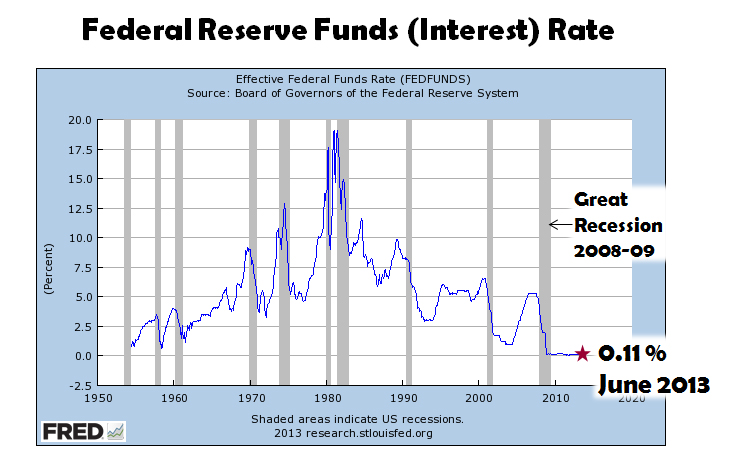
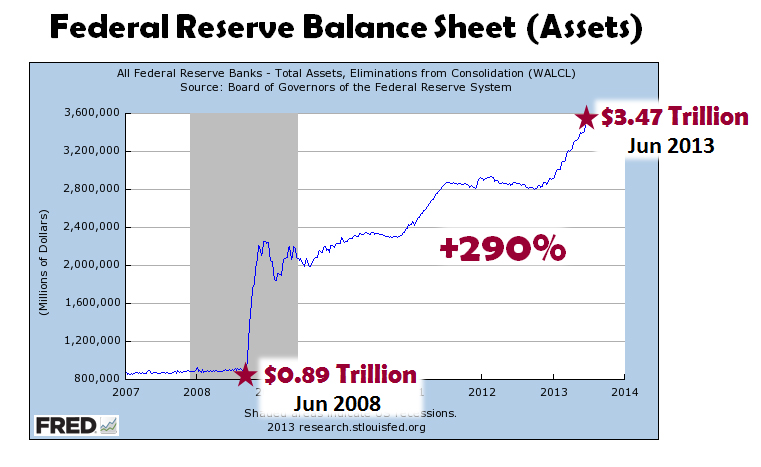
  • The US Congress is responsible for fiscal policy (tax and spending) and the US Federal Reserve System is responsible for monetary policy (printing money and setting interest rates).  As long as the US Congress spends $1 trillion more each year than it takes in taxes and the Fed continues to stimulate the economy at an average of $1 trillion a year, consumption will continue unabated with copious amounts of “easy” money.   This rate of spending cannot last.  Hopefully, the US economy will strong enough to operate on its own when government stimuli end.
  • Domestic financial disruptions, like recessions and periods of inflation, and occur frequently.  Since WWII, the US averaged 1.7 recessions per decade.  So far in this decade (2010 to today), the US has been recession-free mainly due to infusion of trillions of dollars worth of government stimuli.   Inflation is also a major consideration.  So far in 2013, inflation has averaged 1.5%, which is in the normal range.  In 2008, prior to the Great Recession, it was 5.6%.  In 1980, it was 14.7%.  When government stimuli end, many fear that inflation will increase, perhaps significantly.  The next recession and/or an inflationary spiral could be very deleterious to consumption.
  • Global financial disruptions caused by political, economic, military or social malfeasance could trigger changes to US consumption.  Europe and Japan are in recession.  Conflicts in the Middle East continue.  Competition from China remains unabated.  It is unlikely that a single global disruption will have a significant impact on US consumption.  However, a global disruption may have a multiplying effect making a domestic financial disruption worse.  Multiple or cascading global disruptions, especially with our key trading partners, would certainly have an adverse affect on the US economy.
  • US demographic trends signal reduced consumption.   78 million baby-boomers just began to retire.  Retirees are generally fiscally conservative and less prone to large expenditures.  The other demographic group that is buying less is the middle class.  Since year 2000, the middle class has decreased by approximately 6%.  In the same period of time, the number of able-bodied Americans that can work but choose not to work has grown by 20 million people to a total of 90 million, not including 70 million people that cannot work, out of a total population of 316 million.


Potential Consequences of Reduced Consumption.    Depending how the US economy is managed or mismanaged, the consequences of reduced consumption can range from benign to malignant.  The longer we wait to implement meaningful reforms to our long-term challenges the more severe the consequences of reduced consumption.

Unemployment is directly tied to consumption.  One can roughly calculate the consequence a relatively minor drop of 5% in consumption and its impact on unemployment.  A 5% reduction in the US $16 trillion annual GDP would precipitate a loss of approximately 20 million jobs ($16 trillion GDP x 5% = $800 billion/$40,000 annual median personal income = 20,000,000 jobs).  Today, the US employs a total of 136 million citizens, so a reduction of 20 million jobs would equate to approximately 15% of the US work force.   If the layoffs were focused on the poor and the lower middle class making an average personal income of $20,000, the numbers could double.

As shown on the International Comparison chart at the beginning of this article, a 5% reduction in GDP would still make the US highest consuming society tied with the UK at 66%.  Given the volatility in today’s geo-political/economic environment, financial disruptions should be anticipated. Given the severity, duration and number of disruptions, a 5% (or greater) drop is certainly in the realm of the possible.


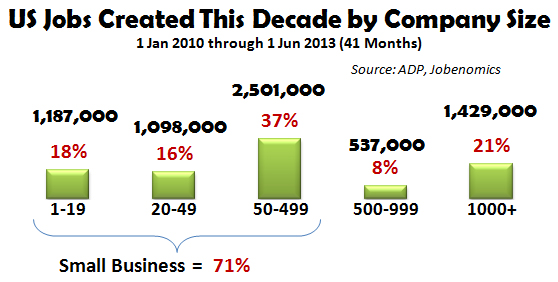
Jobenomics Recommendations.   Jobenomics believes that the best way to mitigate the effects of a potential consumption downturn is to promote small business growth as opposed to massive stimulus packages oriented to government jobs, big business and large financial institutions. Since the beginning of this decade (2010s), small business produced 71% of all new jobs.  Today small business employs 77% of the US labor force (see: Jobenomics Employment Report-August-2013).

Jobenomics also believes that a national initiative involving small, emerging and self-employed business creation would be an insurance policy against future economic downturns.  The creation of 20 million new jobs via small businesses—the engine of the US economy—would mitigate potential reduction of 20 million jobs as calculated above.

 Total New US Jobs By Decade

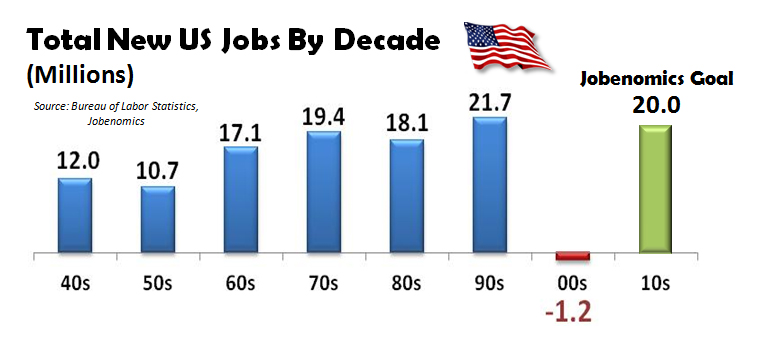
In the 1970s, 1980s and 1990s, the US created an average of 20 million new jobs each decade and can do so again. However, this amount of growth will not transpire using traditional methods.  Jobenomics believes that America needs to focus a model based on sustainability and self-sufficiency enabled by emerging information technologies and an improved national info-structure.  Jobenomics advocates a transition from dependency on large urban institutions to more independent small rural and virtual business networks.  This does mean that we abandon our current model but supplement it with alternatives that have the highest probability for scalability and growth.

Jobenomics is working on three highly-scalable, small business initiatives that could create millions of new jobs.  These initiatives include:  (1) a national effort for Generation Y to monetize social networks via a modernized info-structure, (2) a national direct-care effort to accommodate the aging and children via substantially increasing the number of women-owned businesses, and (3) a national effort to monetize waste streams via waste-to-energy and waste-to-raw materials that could rejuvenate depressed inner cities and the financially disadvantaged.

These three fledging initiatives are representative of the efforts of several hundred dedicated individuals—imagine what our nation could do writ-large.


[1] The Sourcebook for Teaching Science – Strategies, Activities, and Instructional Resources, Television Statistics, IV. Commercialism, http://www.csun.edu/science/health/docs/tv&health.html

[2] World Bank, Household final consumption expenditure, etc. (% of GDP), http://data.worldbank.org/indicator/NE.CON.PETC.ZS

[3] Federal Reserve, Flow of Funds Accounts of the United States, 2007-2013 Q1,  Table F.6 Distribution of Gross Domestic Product, Page 12, 6 Jun 2013, http://www.federalreserve.gov/releases/z1/Current/z1.pdf

[4] US Department of Commerce, Bureau of Economic Analysis, Table 2.3.5U Personal Consumption Expenditures by Major Type of Product and by Major Function, 7 August 2013, http://www.bea.gov/itable/iTable.cfm?ReqID=12&step=1#reqid=12&step=3&isuri=1&1203=14

[5] US Department of Commerce, Bureau of Economic Analysis, Table 2.5.5 Personal Consumption Expenditures by Function, 7 August 2013, http://www.bea.gov/iTable/iTable.cfm?reqid=9&step=3&isuri=1&903=69#reqid=9&step=3&isuri=1&910=X&911=0&903=74&904=2004&905=1000&906=Q

[6] American Bankruptcy Institute, Annual Business and Non-business Filings by Year (1980-2012), Year 2012, http://www.abiworld.org/AM/AMTemplate.cfm?Section=Home&CONTENTID=66471&TEMPLATE=/CM/ContentDisplay.cfm

Stock Markets and The Fed

Download PDF Version: Stock Market and The Fed 1 July 2013

1 July 2013

US stock market performance has been phenomenal since the depths of the Great Recession.  Since March 2009, all three major US indices (Dow Jones, S&P 500 and NASDAQ) have experienced a 4 ½ year bull market as shown below—up as high as 163%.

Stock Market Performance

The big questions facing economists, policy-makers, opinion-leaders and investors are whether (1) this bull market will continue, (2) can the stock markets operate under their own power, and (3) how chaotic will the markets become during tapering of US government subsidies to big business? To answer these questions, one must first consider the level of involvement of the US government, especially the actions of the US Federal Reserve Board—the single most important government agency in relation to stock markets.

The US Federal Reserve System’s, also known as the Federal Reserve or simply the Fed, engagement on monetary and credit policy has immediate consequences for financial institutions, investors and economic recovery.  After 4 ½ year’s of aggressive engagement via printing money, buying securities and manipulating interest rates, an increasing number of investors fear that disengagement by the Fed may have dire consequences regarding the attractiveness of stocks vis-à-vis other investment opportunities, such as commodities, bonds or even cash.  Moreover, many economists fear that stock market has been artificially inflated by government involvement and any tapering by the Fed likely to cause the stock market bubble to deflate, or burst, not only in the US but in fragile economies in Europe and Japan.  Finally, policy-makers and strategic planners are worried that adverse consequences created by Fed cutbacks will have a domino effect on the global geo-political/economic balance of power.

 USG Financial Bailouts to Private Sector

The US government has been stimulating publically-traded financial institutions and corporations to the tune of $16.6 trillion since 2008.  Federal Reserve programs totaled $10.9 trillion, mostly for banks, financial institutions, insurance companies and government sponsored enterprises (Fannie Mae and Freddie Mac—holders of 77% of all American mortgages).  US Treasury programs totaled $2.9 trillion, mostly to individuals and the auto industry.  Federal Deposit Insurance Corporation (FDIC) totaled $2.5 trillion, mostly for local banks. The US Department of Housing and Urban Development (HUD) totaled $306 million, mostly for homeowners via the Federal Housing Administration.  Since the Federal Reserve is responsible for 66% ($10.9 trillion out of $16.6 trillion), it has been the most influential organization in regard to the US economic recovery as well as  4 ½ year bull stock market run.  Consequently, it is important to understand the role of the Fed and its actions in order to anticipate the future of the US stock markets.

The US Federal Reserve System is the central banking system of the United States.  The Fed is both the US government’s bank and the bankers’ bank.  As an independent institution, the Federal Reserve System has the authority to act on its own without prior approval from Congress or the President.  The Fed was created by Congress to be self-financed and is not subject to the congressional budgetary process. In this way, the Fed is considered to be “independent within government.”

The Federal Reserve System has a number of layers.  The top layer is the 7-member Board of Governors, who are appointed by the President and confirmed by the US Senate.  Ben Bernanke is the current Chairman of the Board whose term expires on 31 January 2014.  The second layer is comprised of 12 regional Federal Reserve Bank districts, each with a board of nine directors, 3 of whom are appointed by the Fed’s Board of Governors and 6 are elected by commercial banks in the district.  The third layer consists of approximately 4,900 member banks that are private institutions (mainly national and state-chartered banks). Each member bank is required to subscribe to non-tradable stock in its regional Federal Reserve Bank, entitling them to receive a 6% annual dividend.  While not officially part of the Fed, the Federal Deposit Insurance Corporation is a sister institution with 9,500 members.  The FDIC-insured lending institutions comprise the vast majority of all bank deposits in the US.  A very small number of small banks are neither an FDIC nor a Fed-member bank.

The primary responsibility of the Fed is the formulation of monetary and credit policy in pursuit of maximum employment, stable prices, moderate long-term interest rates, and economic growth.  The Fed normally accomplishes this by setting interest rates, controlling the money supply by printing money and trading government securities, and regulating the amount of reserves held by banks.

 Federal Reserve Funds (Interest) Rate

One of the first actions that the Fed initiated was lowering interest rates to almost zero to simulate the economy.  As shown above, the Fed lowered the Federal Fund Rate to near-zero prior the end of the recession—the lowest rate in 60 years.  Today, four and half years later, this rate remains at near-zero (0.11%).  To understand the role that the Federal Funds Rate plays in the banking system, one must first understand the four layers of interest.

  • Federal Funds Rate.  The federal funds rate (currently 0.11%) is the rate of interest at which federal funds are traded among banks, pegged by the Federal Reserve through its Open Market Operations.
  • Federal Reserve Discount Rate.  The discount rate (currently 0.75%) is the rate that the Fed charges its depository banks and thrifts who need to borrow money from the Fed.  The Fed directly sets the discount rate based on the economic/monetary policy it wants to achieve, as well as the underlying rates that banks charge one another.
  • Prime Rate.  The prime rate (currently 3.25%) is the interest rate offered by banks to their most valued customers.  The prime rate is based on the discount rate.
  • Bank Rate. Most consumers are familiar with the interest at their local bank when they apply for a mortgage, auto or other loan.  The bank rate (currently 4% to 6%) is based on the prime rate.

Consequently, the Federal Funds Rate sets the baseline interest rate that all other rates are based upon.   Since virtually every US bank sets its rates on underlying Fed rates, the magnitude of the Fed’s near-zero rate policy is profound.   Unfortunately this near-zero rate has not produced a robust US economic recovery as anticipated.  While stocks and corporate profits have soared, GDP growth, employment and lending have languished with dire impact on the American middle class.

When a near-zero Federal Funds Rate does not achieve the desired monetary effect (stimulating economic growth), the Fed turns to other measures since they are not able to reduce interest rates below zero.   Normally, the Fed stays out of the private sector, but these are not normal times.  As a result of the 2008-09 economic crisis, the Fed was compelled to enter the private sector in essentially three ways:

  • Printing money to increase liquidity to increase lending by banks,
  • Rescuing too-big-to-fail financial institutions, and
  • Buying mortgage-backed securities that are toxic to banks, major financial institutions and insurance companies.

After September 2008, the Fed launched a massive liquidity effort by pouring trillions of dollars in short-term lending into financial firms and corporations.  A host of new programs was created, including repurchase agreements, term auction credits, commercial paper funding facility, liquidity swaps and various other loans and bailouts.  This liquidity effort was designed to be temporary in nature with a minimum risk to inflation.  The liquidity effort worked.  It saved a number of banks and corporations (such as the automotive industry) from insolvency without creating inflation.  This liquidity, coupled with near-zero interest rates, has also found its way into the US stock markets, which have now recovered their losses since the Great Recession.

 Federal Reserve Balance Sheet

Since 2008 to today, the Fed has purchased approximately $3.5 trillion in toxic financial instruments from the private sector.  In essence, the Fed is now carrying the bad debt that formerly resided on the balance sheets of major financial institutions and corporations.

The Fed also launched an aggressive asset purchase program, called quantitative easing or QE.  Quantitative easing involves buying securities, which increases the money supply, which promotes increased liquidity and lending.  Over time, the Fed’s purchases of these assets was supposed to promote new business investment that, in turn, would bolster economic activity, create new jobs, and reduce the unemployment rate.  While QE has bolstered the stock markets, it has done little for business investment or unemployment.

 Effects of Feds Stimulating S&P500

The effect of the Fed’s quantitative easing programs can be seen on the performance of the S&P 500 stock market, which is comprised of America’s top 500 publically-traded companies.  As shown on the graph above, every time the Fed initiated a quantitative easing program the S&P 500 grew significantly.   The opposite effect happened when the quantitative easing programs ended—the markets declined. The same effects happened with other US and foreign stock markets.

  • QE1 (Quantitative Easing #1) occurred between December 2008 and March 2010 and involved a total of $1.75 trillion dollars worth of purchases of toxic mortgage-backed securities ($1.25 trillion) and debt ($200 billion) from Fannie Mae, Freddie Mac, Ginnie Mae and the Federal Home Loan Banks, and $300 billion of long-term Treasury securities. The main purpose was to support the housing market, which was devastated by the subprime mortgage crisis.
  • QE2 (Quantitative Easing #2) occurred between November 2010 and June 2011 and involved $600 billion dollars worth of purchases of long-term Treasuries at a rate of $75 billion per month.  Treasuries include treasury bonds, notes, and bills. The Fed buys treasury securities when it wants to increase the flow of money and credit, and sells when it wants to reduce the flow.  In essence, after the Fed purchases treasury securities, it adds a credit to member banks, which increases the amount of money in the banking system and ultimately stimulates the economy by increasing business and consumer spending because banks have more money to lend at lowered interest rates.
  • QT1/2 (Operation Twist #1 & #2) occurred between September 2011 to December 2012 and involved a total of $667 billion.  Operation Twist was a plan to purchase bonds with maturities of 6 to 30 years and to sell bonds with maturities less than 3 years, which pressured the long-term bond yields downward and extended the average maturity of the Fed’s own portfolio.
  • QE3/4 (Quantitative Easing #3/#4) started in September 2012 and continues today open-ended until the economy recovers and the official employment rate drops below 7%.  QE3 provided for an open-ended commitment to purchase $40 billion agency mortgage-backed securities per month until the labor market improves “substantially”.  QE4 authorized up to $40 billion worth of agency mortgage-backed securities per month, and $45 billion worth of longer-term Treasury securities.

 DOW versus Fed Assets

This graph shows the relationship between the Dow Jones Industrial Average (top 30 US publically-traded companies) and the Federal Reserve’s balance sheet.  The Fed’s purchase of toxic mortgage-backed securities from the private sector and Treasuries has bolstered stock markets worldwide, as well boosting US corporate profits to an all-time high as shown below.

 Corporate Taxes After Tax

Corporate profitability can be directly tied to the Fed’s involvement.  First, low interest rates encouraged investors to buys stocks as opposed to traditional investments like savings accounts, certificates of deposits (CDs) and money market accounts since their rate of return was low due to low Federal rates.  Secondly, corporate bonds (even those rated as junk bonds status) offering meager dividends (compared to savings, CDs and money markets) sold briskly allowing corporations to build up their cash reserves and profitability.  Rather than hiring or recapitalizing, many corporations used this cash for mergers, acquisitions and buy-backs of their own shares that increased their own net worth as well as their investors.  In most cases, these corporate actions were wise financially.  Corporate officials knew that the “era of easy money” stimulated by the Fed would eventually end, and building up cash reserves was fiscally responsible until the US economy showed real signs of recovery, which has not happened.

 Corporate Profits After Tax vrs Money in Circulation

What do we mean by the “era of easy money”?  The above chart is an exploded view of corporate profitability from 2008 to today (April 2013) that is overlaid by money in circulation that is controlled by the Fed.  During the period, corporate profits rose by $1.1 trillion versus a $2.2 trillion rise in money in circulation.  While rising about half the rate of the money supply, corporate profits generally followed the same upward path.  This generous supply of easy money allowed corporations to borrow at low interest rates for mergers, acquisitions and buy-backs.  In addition, easy money depressed the value of the US dollar relative to other currencies, which made US exports (the domain of big business) more competitive.

The old adage “make hay while the sun shines” is applicable to corporations and their investors in the stock markets.  The Fed Chairman has recently indicated that the era of low interest rates, excessive borrowing and quantitative easing are about to end.  In other words, the era of easy money is about over and the markets will have to operate with less and less government subsidies.  It is clear that the stock markets are addicted to these subsidies and are adverse to any withdrawal.    On 20 June 2013, the Dow Jones and the S&P 500 had their biggest point losses in more than a year and a half after Federal Reserve Chairman Ben Bernanke hinted that the Fed could begin dialing back its economic stimulus later this year.  After 4 1/2 years of Fed’s quantitative easing levitating stock markets and low interest rates, many investors are terrified by the prospect of market chaos without the underwriting of the Fed.

The probability of market chaos is a given.  However, there are two views.  The view that is held by most economists, policy-makers and opinion-leaders is that the markets will undergo a period of turbulence but will recover due to structural soundness and historical precedent.  Jobenomics takes the opposite view.  Jobenomics asserts that the US economy is structurally flawed because Americans, from Wall Street to Main Street, shifted emphasis from manufacturing and producing to investing and speculating over the last three decades.   Three decades ago, the US was the largest creditor nation in the world and commanded the lion’s share of global GDP.  Today, we are the largest creditor nation in the world and our share of GDP has diminished significantly—largely due emerging economies like China.   Jobenomics also asserts that the $16.6 trillion spent by the federal government was not well spent as evidenced by the low rate of US GDP growth, high unemployment, exponential growth of people leaving the US labor force, our dwindling middle class, and a hundred million US citizens dependent on government handouts and welfare payments.

To grow an economy, a nation needs three essential factors: (1) sound monetary policy, (2) sound fiscal policy, and (3) private sector growth.  The Fed is responsible for monetary policy.  Under Chairman Bernanke’s leadership, the Fed has done an admirable job by keeping our economy from going over the proverbial fiscal cliff.  However, the Fed cannot produce economic growth, it can only stimulate and incentivize.  Congress is responsible for fiscal policy.  Their failure to resolve debts and deficits, taxation and budgeting, as well as a host of other economic and employment issues are major obstacles to economic growth.  Private sector businesses are ultimately responsible for economic growth.  Unfortunately in this era of big government, private sector businesses have suffered.  Moreover, many Americans and politicians view businesses as a necessary evil or as a check book for social programs.  Until these negative attitudes change, American economic recovery will be tentative at best.

Jobenomics believes that the best prescription for economic prosperity lies with small business creation with emphasis on startup, emerging and self-employed businesses.

 US Jobs Created This Decade by Company Size

Since the beginning of this decade, small business produced 71% of all new jobs.  This is an amazing statistic considering the adverse lending environment by financial institutions, mounting government regulation, and the pittance of federal government spending on small businesses.  Equally important, is the lack of commercial lending to very small and startup businesses that have been starved for capital.  Very small and startup businesses have traditionally been the primary source of employment for entry-level workers and the long-term unemployed.  Had the US government paid more attention to small business rather than providing generous subsidies to big business, Jobenomics estimates that ten million more Americans would be employed today if government focused on key next-generation business initiatives.   Jobenomics is working on three next-generation business initiatives that could potentially ten million new jobs.  These initiatives include:  (1) a national effort for Generation Y to monetize social networks via a modernized info-structure, (2) a national direct-care effort to accommodate the aging and children via substantially increasing the number of women-owned businesses, and (3) a national effort to monetize waste streams via waste-to-energy and waste-to-raw materials that could rejuvenate depressed inner cities and the financially disadvantaged.

In conclusion, stock market success may be more of an illusion than reality.  At some point in time, US federal government subsidies to financial institutions and corporations will end.  When that time happens, we will find out if the markets can operate under their own power.   Until then, America needs to diversify its investment strategy starting with small business, the engine of the US economy. Now is an ideal time to implement a new investment strategy to replace the old one that Chairman Bernanke says is about to end.