Highlights of this posting:
- The US construction industry was one of the hardest hit industries in the Great Recession and is the second worst industry in terms of employment of the ten private sectors industries.
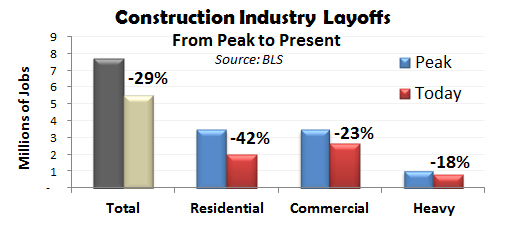
- Overall construction industry employment is down -29% with the residential sector down -42%, nonresidential (commercial building) down -23% and the non-building publically financed infrastructure/heavy construction/civil engineering sector down -18%. The official unemployment rate for this industry is 14.2% as of June 2012.
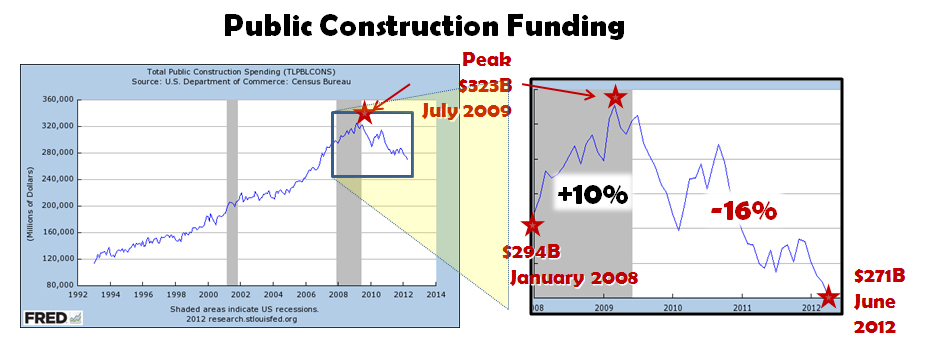
- Overall construction industry spending is down from peak -32% with the residential sector down -62%, nonresidential (commercial building) down -29% and the non-building publically financed infrastructure/heavy construction/civil engineering sector down -16%.
- Jobenomics forecasts that:
- The residential construction industry will not significantly increase in the foreseeable future.
- The commercial industry will not increase significantly in the US but has potential international opportunities in emerging markets.
- The publically funded infrastructure/heavy industry/civil engineering sector will not increase significantly due to federal/state deficits and debt.
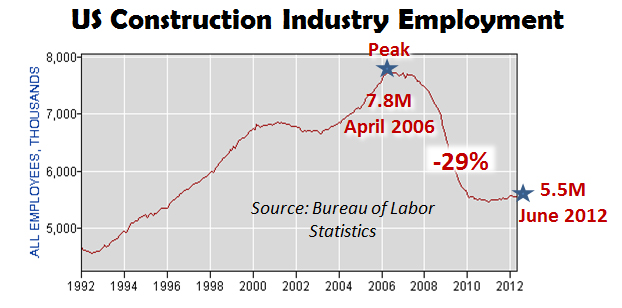
Over the last three decades, the US construction industry grew from approximately 4 million employees to peak employment of 7.8 million in April 2006 when the decline began. The Great Recession of 2008/09 accelerated a rapid decline. Today, the US construction industry has 5.5 million employees—a decline of -29% from the peak six years earlier. As of June 2012, the Bureau of Labor Statistics (BLS) reports that the US Construction Industry has an unemployment rate of 14.2% compared to a national average of 8.2%[1].
From the employment peak, residential construction lost -42%, commercial construction -23% and heavy construction lost 18%.
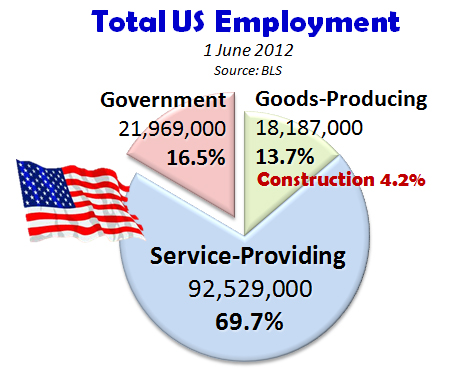
As a percentage of total US employment, the construction industry now represents only 4.2% of the US workforce.
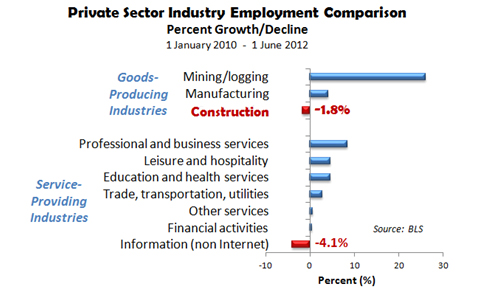
Since the beginning of this decade (‘10s), all private sector industries have been growing with the exception of Information (-4.1%) and Construction (-1.8%). The Information (e.g., publishing, broadcasting) industry’s decline is largely due to the Internet, whereas the Construction industry decline is largely due weakness in the residential housing and commercial building sectors.
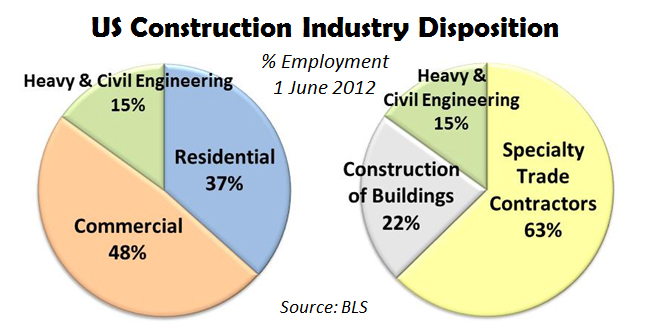
The US construction industry can be characterized by type or labor category. By project type, according to the Department of Labor, this industry is 48% nonresidential commercial, 37% residential and 15% heavy & civil engineering (often called infrastructure or nonbuilding). By labor category, this industry is 63% specialty trade contractors, 22% construction of buildings and 15% heavy and civil engineering.
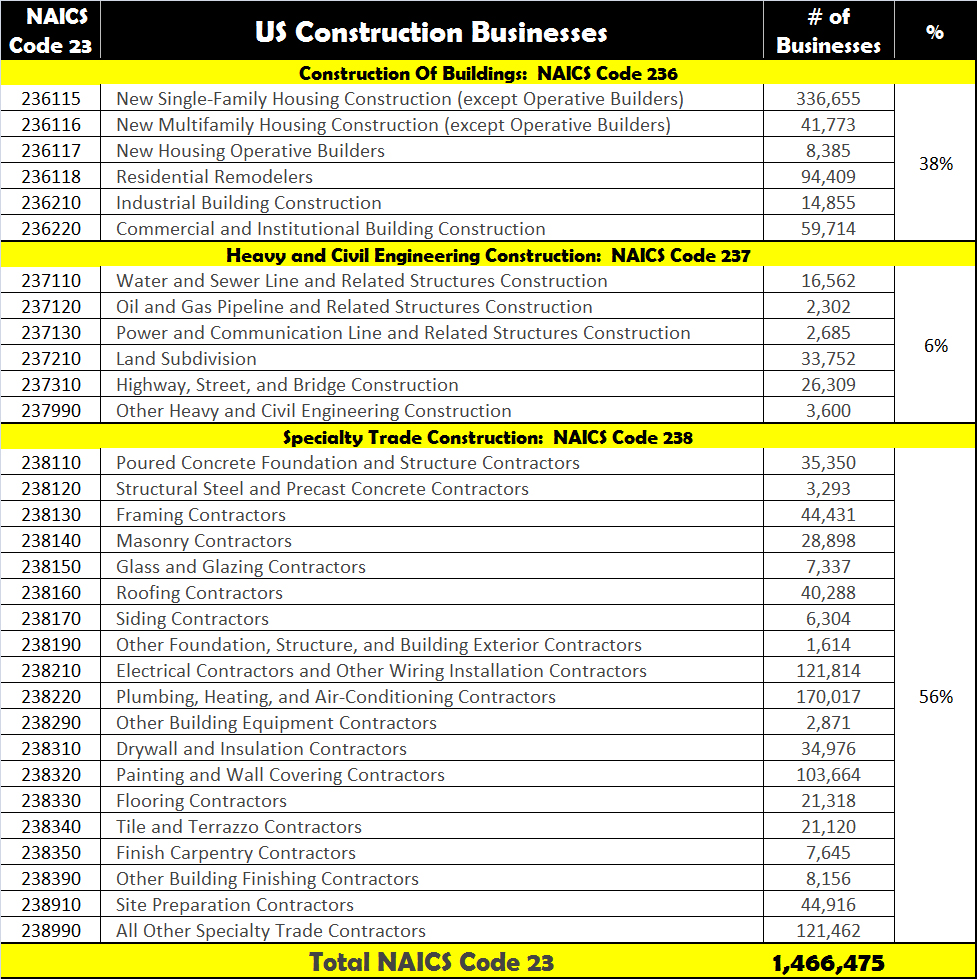
The Construction Industry is classified by the North American Industry Classification System as NAICS Code 23, shown above. The NAICS Association reports that NAICS Code 23 consists of 1,466,475 million businesses[2]. Consequently, by dividing the number of businesses by the total number employed (5.5 million), the US construction industry can be characterized largely as an industry of small firms with an average of 3.8 employees. According to the Professional Builder’s 2011 Housing Giants Rankings , the top 225 US Home Builders accounted for only 19% or $48.6 billion out of the $254 billion spent on residential construction. The top 10 US residential home builders accounted for only 9% or $22 billion of the total.
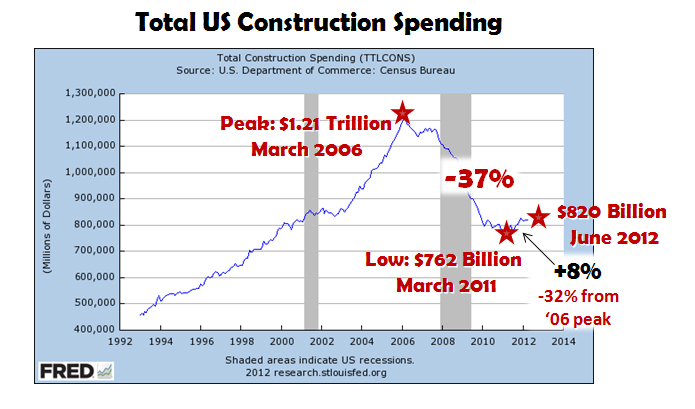
The Federal Reserve Bank of St. Louis (FRED) provides a view of US construction spending. Total construction spending peaked in March 2006 at a total of $1.21 trillion and hit a 15-year low in March 2011 at $762 billion, a -37% decline. Today (June 2012), total construction spending is $820, a +8% increase from the 2011 low.
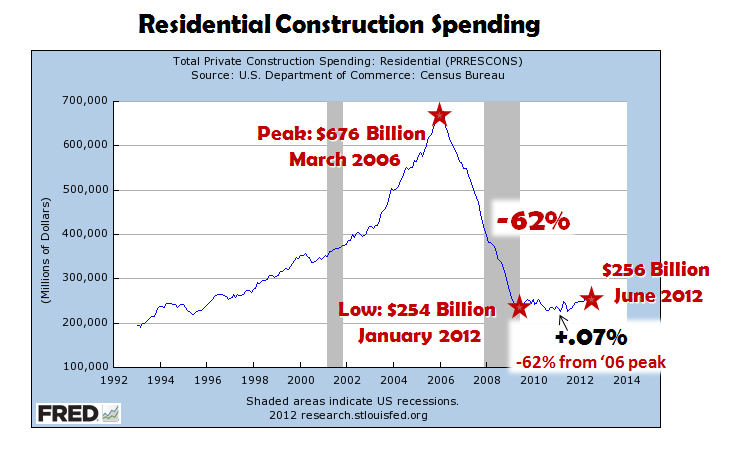
The residential construction industry peaked in March 2006 at $414 billion (two years before the Recession) and hit a 20-year low in September 2010 at $228 billion, a -66% decline. Today, it is $256 billion, up +12% from its low in 2010 but still down -62% from peak.
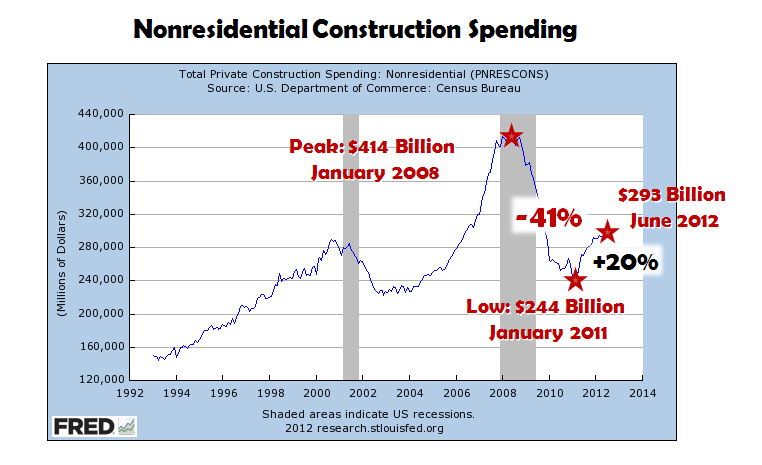
The nonresidential (private sector commercial building) construction industry peaked in January 2008 at $414 billion and hit a 15-year low in 2011 at $244 billion, a -41% decline. Today, it is $293 billion, up +20% from its low in 2011 but still down -29% from peak.
Public construction (heavy construction and civil engineering) spending peaked in July 2009 at $323 billion and hit its current low today at $271 billion, a -16% decline. As the chart indicates, the federal government stimuli (i.e., politically-oriented, shovel-ready, infrastructure projects) increased public construction at the beginning of the recession ($294 billion in January 2008), which lifted this sector +10% to its peak latter in the recession. After the recession, government spending has decreased significantly.
Jobenomics studies US and international economic trends. Jobenomics assesses the following probabilities regarding the overall US economy: 30% chance that the economy will improve, 30% that it will continue to muddle along, and 40% it will get worse, or perhaps much worse, depending on the severity of potential financial disruptions. For a more detailed discussion on why Jobenomics assigns these percentages to the US economic future read Jobenomics (the book) or visit our website (www.Jobenomics.com). Since the US construction industry is one of the bottom performers of all US industries, Jobenomics assesses the chances that the overall US construction industry will not improve significantly in the foreseeable future with the exception of the commercial sector that has opportunities in foreign markets. Jobenomics forecasts that:
- The residential construction industry will not significantly increase in the foreseeable future.
- The commercial industry will not increase significantly in the US but has potential international opportunities in emerging markets.
- The publically funded infrastructure/heavy industry/civil engineering sector will not increase significantly due to federal/state deficits and debt.
Residential Construction Industry. Jobenomics assesses the chances that the US residential construction industry will improve at 10%, remain stagnant at 20%, and will worsen at 70%. This assessment is a nationwide assessment. However, like real estate, the residential construction industry is largely local. Residential traditionally has been the driving-force in the construction industry. However, this may no longer be true.
This chart shows the total number of privately owned residential new starts since the middle 1950s. The January 2006 peak almost reached the previous peak in January 1972. Then the US housing bubble burst which contributed significantly the Great Recession two years later. From the peak in 2006, the number of residential new starts plummeted a staggering 79% to historic lows by April 2009. Since April 2009, the number of new homes increased from 478,000 to 717,000 today, a +50% increase but still -68% from the 2006 peak.
For the foreseeable future, Jobenomics predicts that new starts will not appreciate at a significant rate, due to the following factors:
1. Slow growth of the overall economy
2. Chronically high unemployment and a shrinking middle class
3. Distressed selling due to:
a. Foreclosures
b. Delinquent mortgages
c. Underwater mortgages
d. Strategic defaults
4. Changing attitudes on home ownership (more people renting)
Other leading economics agree with this Jobenomics assessment. According to Yale economics professor Robert Shiller, the co-creator of the Standard & Poor’s/Case-Shiller home price index, “I worry that we might not see a really major turnaround in our lifetimes” for the residential real estate market[3].
Nonresidential & Nonbuilding Construction. Jobenomics assesses the chances that the US nonresidential and nonbuilding construction (infrastructure, heavy and civil engineering) industries will improve at 20%, remain stagnant at 30%, and will worsen at 50%. These two sectors did not suffer to the extent that their residential counterparts did during the housing bubble burst and Great Recession. In addition, they were the beneficiaries of more government stimuli (e.g., “shovel-ready” infrastructure projects) than residential. Assuming no major domestic or foreign disruptions to the US economy, Jobenomics believes that worst may be over for the nonresidential and nonbuilding construction industries. Unlike residential construction, the nonresidential and nonbuilding construction industries have upside potential in the international marketplace that could offset downward trends in domestic public sector funding.
Most construction analysts predict that the US government public sector funding growth will resume as it has done in the past. Jobenomics disagrees due to the magnitude of public debts and deficits. A quick look at the largest government agency, the US Department of Defense, is indicative of what will happen to other government agencies including federal, state and local government agencies. The US Department of Defense’s Military Construction Budget is dropping precipitously due to budget constraints. The DoD’s Fiscal Year 11 (actual), FY12 (actual) and FY13 (planned) construction budgets (TOA, total obligation authority) where $20.1 billion, $13.9 billion and $11.2 billion respectively. The difference between FY11 and FY13 is $8.9 billion, a decline of 44%.
McGraw-Hill Construction, a mainstay in construction industry forecasting, predicts that upsides in private sector construction financing (plants, warehouses, hotels, and commercial buildings) will be offset by large declines in public sector construction projects funded by municipal, state and federal governments. New public sector projects like school, healthcare, electric utility and other public works programs (bridges, parks, roads) are problematic due to fiscal constraints at all levels of government. In addition, new industry entrants face challenges with access to capital. Strict lending standards will continue to exclude many general contractors from being eligible for loans.
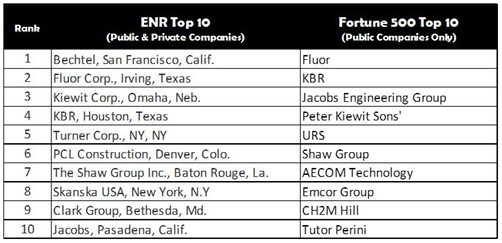
Compared to their residential counterparts, larger corporations play a much larger role in the nonresidential and nonbuilding construction sectors. There is some debate on the size and revenues of the major US construction corporations due the fact that many are private corporations. However, the ENR (Engineering News Record) and Fortune 500’s Top 10 US Contractor Lists for 2011 represent the major players in the nonresidential and nonbuilding construction sectors.
Bechtel and Fluor are not only the leading US construction firms; they are the trendsetters for the entire US nonresidential and nonbuilding construction industries. From a Jobenomics perspective, the future of all US construction corporations will largely depend on their success in the international arena with emphasis on emerging economies and economics within our own hemisphere (Canada and Mexico).
Bechtel Corporation (Bechtel Group) is the largest engineering company in the United States, ranking as the 5th largest privately owned company in the US[4]. In 2011, Bechtel had $32.9 billion in total revenue (up from $27.0B in 2007) and employed 53,000 workers on projects in nearly 50 countries. Bechtel doubled its New Work to $53 billion in 2011 from $21.3 billion in 2010 and $20.3 billion in 2009. Fluor Corporation is one of the world’s largest publically owned engineering, procurement, construction, maintenance and project management companies[5]. In 2011, Fluor had $23.4 billion in total revenue (up from $16.7B in 2007) in revenue and employed 43,000 workers on projects six continents. Fluor’s international business sectors (in order of consolidated backlog by region) are: 24% Australia, 22% United States, 16% Canada, 15% Latin America, 13% Middle East, 6% Europe, 2% Asia Pacific and 2% Africa. According to Fluor, Fluor’s future growth is dependent on international business as opposed to domestic US.
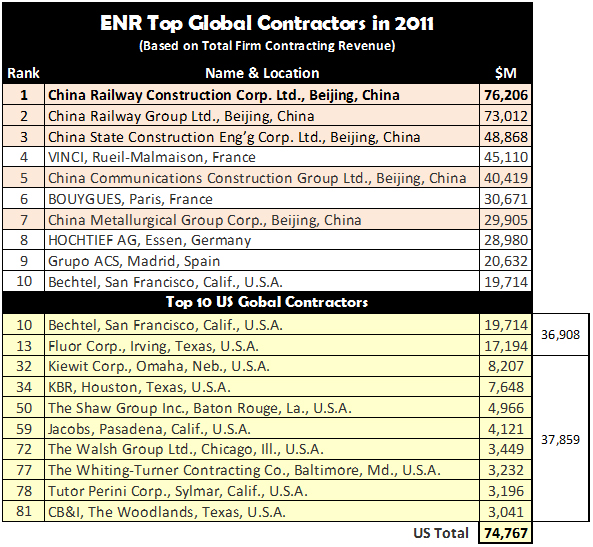
The following chart (extracted from ENR’s Top 225 Global Contractors list for 2011[6])) shows the top 10 global contractors (Bechtel #10) as well as the top 10 US global contractors (Bechtel #1)
Within the global top 10, Chinese companies had 5 positions and Europeans had 4 positions. Bechtel, the lone US company, occupied the 10th position. The top 10 US contractors earned a combined total $74.767 billion in 2011. The top single Chinese contractor (China Railway Construction Corporation) earned slightly more ($76.206 billion) than the total of the top 10 US contractors. Bechtel and Fluor earned almost as much as the next 8th largest US companies ($36.9B versus $37.9B). From a Jobenomics point-of-view, the international market holds immense potential for US construction industry, including US domestic homebuilders. What is needed is a common vision and collective game plan.
[1] Bureau of Labor Statistics, Industries at a Glance, Construction: NAICS 23, http://www.bls.gov/iag/tgs/iag23.htm, 21 Mar 12
[2] NAICS Association, Six-Digit NAICS Codes & Titles, http://www.naics.com/free-code-search/sixdigitnaics.html?code=23, 21 Mar 12
[3] MSNBC, Economy Watch, http://economywatch.msnbc.msn.com/_news/2012/04/24/11369617-home-prices-up-for-first-time-in-10-months?chromedomain=bottomline&lite, 20 Apr 12
[4] Forbes, Largest Private Companies in 2011, http://www.forbes.com/lists/2011/21/private-companies-11_Bechtel_800U.html
[5] Fluor, Investor Relations, 2011 Annual Report, http://investor.fluor.com/phoenix.zhtml?c=124955&p=irol-irhome
[6] ENR, Top 225 Global Contractors: 2011, http://enr.construction.com/toplists/GlobalContractors/001-100.asp

