
Jobenomics U.S. Employment Analysis: Q2 2016

Jobenomics U.S. Employment Analysis: Q2 2016
By: Chuck Vollmer
31 July 2016
Download 100-page report at:
Jobenomics U.S. Employment Analysis - Q2 2016 - 31 July 2016
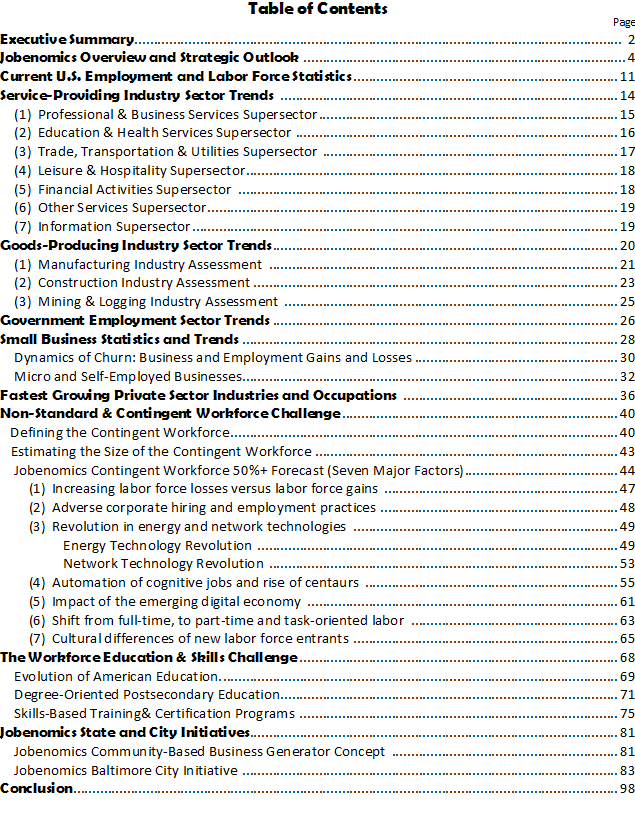
Jobenomics reports on U.S. employment and unemployment size, characteristics and trends. This Employment Analysis focuses on the U.S. labor force, business and job creation, and transformative trends—with emphasis on the 60 million workers in the rapidly growing, and underreported, contingent workforce. The companion Unemployment Analysis focuses on how the U.S. government reports on unemployment and income statistics, why Americans who can work chose not to work, and the impact of 109.8 million non-working able-bodied citizens are having on the United States.
Executive Summary
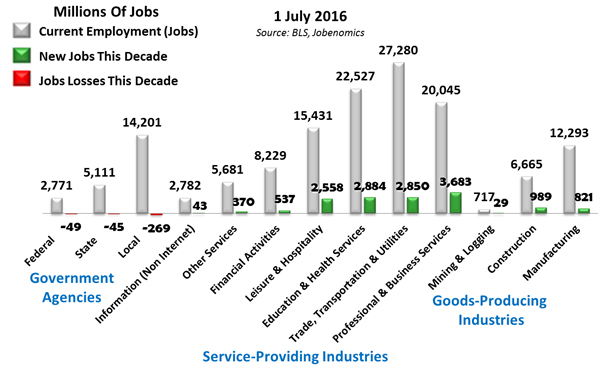
Current U.S. employment and job gains/loss statistics since the beginning of the decade are shown above. Between 1 January 2010 and 1 July 2016, the United States has created 14,401,000 new jobs with a net gain of 14,764,000 in the private sector and a net loss of 363,000 in government employment. 81.1% of all new jobs this decade were produced by four service-providing industries (Professional & Business Services; Education & Health Services; Trade, Transportation & Utilities; Leisure & Hospitality). Manufacturing and Construction industries contributed 5.6% and 6.7%, respectively. 77.9% of all Americans are now employed by small businesses that created 77.7% of all new jobs this decade. In June 2016, small businesses created 85.4% of all new jobs with micro-businesses (1-19 workers) employing 69% more Americans than all large corporations with over 1000 employees.
While these employment statistics are positive, they are offset by three trends that threaten economic growth and stability. These disturbing trends include voluntary workforce departures, contingent workforce growth and sclerotic GDP growth.
- Voluntary Workforce Departures. In Q2 2016, the U.S. labor force lost 593,000 more workers than it gained due to the exodus of frustrated job-seekers and able-bodied workers to welfare and alternative lifestyles. Since year 2000, 25,862,000 able-bodied workers departed versus 13,395,000 workers who joined the labor force for a net loss of 12,467,000 workers. This net loss does not include the number of unemployed (2.1 million more people are unemployed in 2016 than 2000) or population growth (42 million additional Americans today compared to 2000).
- Contingent Workforce Growth. Contingent workers are defined by the U.S. government as “non-standard” workers who work part-time by necessity (temps and day workers) or by choice (free lancers and self-employed). Today, the contingent workforce is approximately 60,000,000 employed Americans or 40% of the total employed workforce. By 2030, this number will grow to 80,000,000 or 50% of the U.S. employed workforce—a trend that is largely unknown to U.S. policy-makers and the American public.
- Sclerotic GDP Growth. Most economists believe that economic growth depends on job and GDP growth. The ideal rate for U.S. GDP growth is 2% to 3%. Since 2000, U.S. GDP averaged a sclerotic 1.76%. During the post-recession recovery period to today, U.S. GDP averaged only 2.0%. In Q1 2016, U.S. GDP grew by an abysmal 0.8%. Q2 2016 is estimated to be not much better at 1.2%.
Job creation is the number one issue facing U.S. in regard to economic growth, sustainment and prosperity. Jobs do not create jobs, businesses do, especially small businesses. Unfortunately, America is focused on big business and government employment solutions that have not been very effective growing the U.S. labor force. In fact, the U.S. labor force is in a state of decline as evidenced by the eroding middle-class and the transformation from full-time to contingency workers.
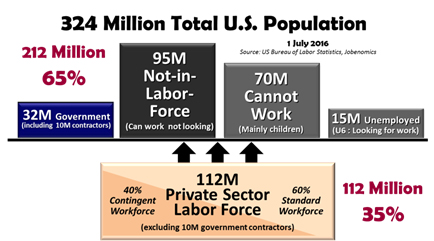
35% of all Americans financially support the rest of the country. As of 1 July 2016, out of a U.S. population of 324 million, 112 million private sector workers support 32 million government workers and government contractors, 95 million able-bodied people who can work but chose not to work, 70 million who cannot work, and 15 million unemployed and underemployed. The U.S. economy is not sustainable with only 35% supporting an overhead of 65%. The growing contingent labor force, which consists of mostly lower paid wage earners, makes the overhead burden even more precarious. More people with livable wages and greater discretionary income must be productively engaged in the private sector labor force for the U.S. economy to flourish.

2 comments
Leave a reply


Recommended reading
- Casinos Not On Gamstop
- Casino Non Aams
- Casino Not On Gamstop
- Casino Non Aams
- UK Casinos Not On Gamstop
- Non Gamstop Casinos
- Non Gamstop Sports Betting Sites
- Online Casinos UK
- Non Gamstop Casino Sites UK
- Non Gamstop Casino Sites UK
- Non Gamstop Casino Sites UK
- Slots Not On Gamstop
- Non Gamstop Casino Sites UK
- Non Gamstop Casino Sites UK
- Non Gamstop UK Casinos
- Non Gamstop Casino Sites UK
- Top Casino Sites UK
- Best Casino Sites UK
- UK Casino Sites Not On Gamstop
- Meilleur Casino En Ligne
- Meilleur Casino En Ligne
- Gambling Sites Not On Gamstop
- Best Non Gamstop Casino
- UK Casino Sites Not On Gamstop
- Gambling Sites Not On Gamstop
- Crypto Casinos
- Jeux Casino En Ligne
- Meilleur Site Casino En Ligne Belgique
- I Migliori Casino Non Aams
- ライブカジノ ポーカー
- 本人 確認 不要 オンライン カジノ
- 코인카지노
- букмекерские конторы
- カジノ バカラ
- ライブカジノ バカラ
- Casino Avec Bonus Sans Depot
- Jouer Au Casino En Ligne
- Casino En Ligne
- Casino En Ligne Francais
- Casinos En Ligne
- Siti Scommesse Sportive Non Aams
- Nouveau Casino En Ligne
- Casino En Ligne
- Casino En Ligne France
- Casinos Online
Regarding the last paragragh. Is why I say the salaries of those employed in government jobs needs to come down. Low level employees average more money yearly than a low level employee of the same type job in the private sector when compared by the length in that position. Also the salaries of some high level public/government jobs pay well over any high level private sector jobs.
Lets Go with the Trump Evonomic Plan…..
The increase in GDP = increase in jobs…..
I Agree…..More Chickens More Eggs More Happy Americans……
Also take note of the Taxing structure plan…
Gives reason to Biuld and Hire more Business……
Pres. Coolidge had to pull tricks out of the hat on taxes also…to keep America on a Steady Pace..again America First!