Jobenomics Community-Based Business Generators

 Jobenomics Community-Based Business Generators

www.Jobenomics.com

By: Chuck Vollmer

15 August 2016

Download PDF:

Jobenomics Community-Based Business Generators - 15 August 2016

The way that government and big business can plan, manage and support small business and job creation is via community-based business incubators, business accelerators and business generators.

Business incubators tend to focus high-tech, silver bullet innovations that have extraordinary growth and employment potential.   Business accelerators focus on expanding existing businesses in order to make them larger and more profitable.  The Jobenomics business generator concept involves mass-producing small and self-employed business with emphasis on lower-tech but plentiful service-providing businesses at the base of America’s economic pyramid.  Many cities have business incubators, usually located at or around universities or technology parks, and business accelerators that are associated with mezzanine financing institutions.  Jobenomics is working with cities and states to create business generators to mass-produce startup small and self-employed businesses.

JCBBG Concept

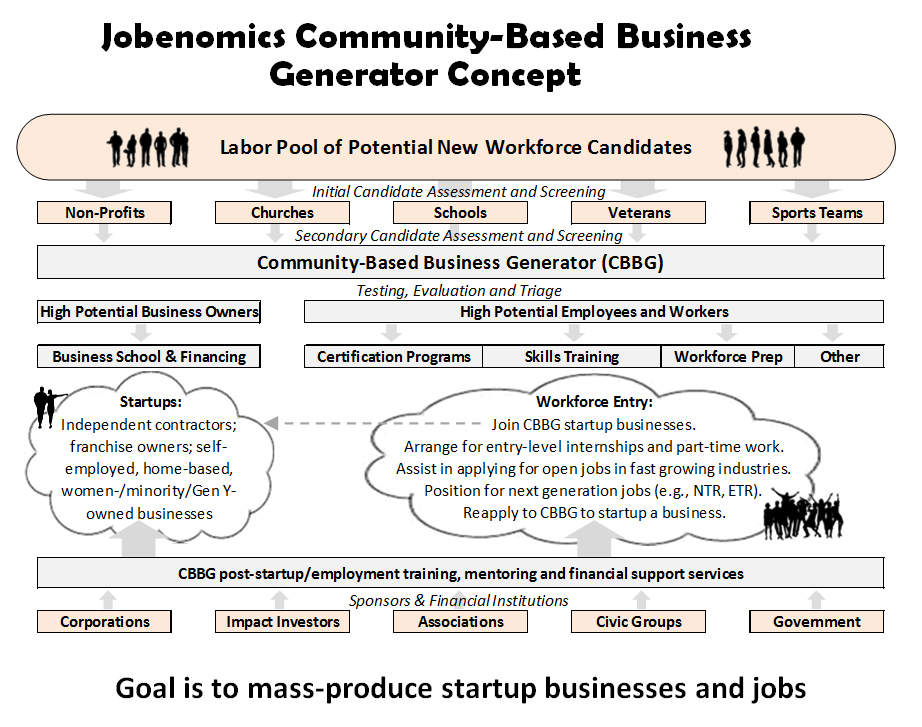
Jobenomics Community-Based Business Generators mass-produce startup businesses by: (1) working with community leaders to identify high-potential business owners and employees, (2) executing a due diligence process to identify potential high quality business leaders and employees, (3) training and certifying these leaders and employees in targeted occupations, (4) creating highly repeatable and highly scalable “turn-key” small and self-employed businesses, (5) establishing sources of startup funding, recurring funding and contracts to provide a consistent source of revenue for new businesses after incorporation, and (6) providing mentoring and back-office support services to extend the life span and profitability of businesses created by the Jobenomics Community-Based Business Generators.

The process starts by using community leaders to identify high potential job seekers.  Churches, non-profit institutions, schools, sports teams and veterans groups are a great source for identifying talent, desire and fortitude.  These organizations provide the first phase of the triage process by screening and assessing high performance people who are known to them. The second stage is accomplished during onboarding that involves Jobenomics screening and assessing.  The third stage uses aptitude and personality tests to determine potential career paths.

Once completed, candidates will be separated into a business leader group or a high potential employee group for training.  The leader group will undergo management and startup business training.  The employee group will undergo skills training based on the role that they will assume in the startup business (operational, technical, mechanical, financial, marketing, administrative, etc.).  After the training is completed and certifications awarded, the team will commence startup operations under the guidance and assistance of the Jobenomics Community-Based Business Generator team.  Jobenomics contends that Community-Based Business Generators could vastly improve the rate of startups and expanding businesses, and reduce the rate of contracting and closing businesses.

JCBBG Process

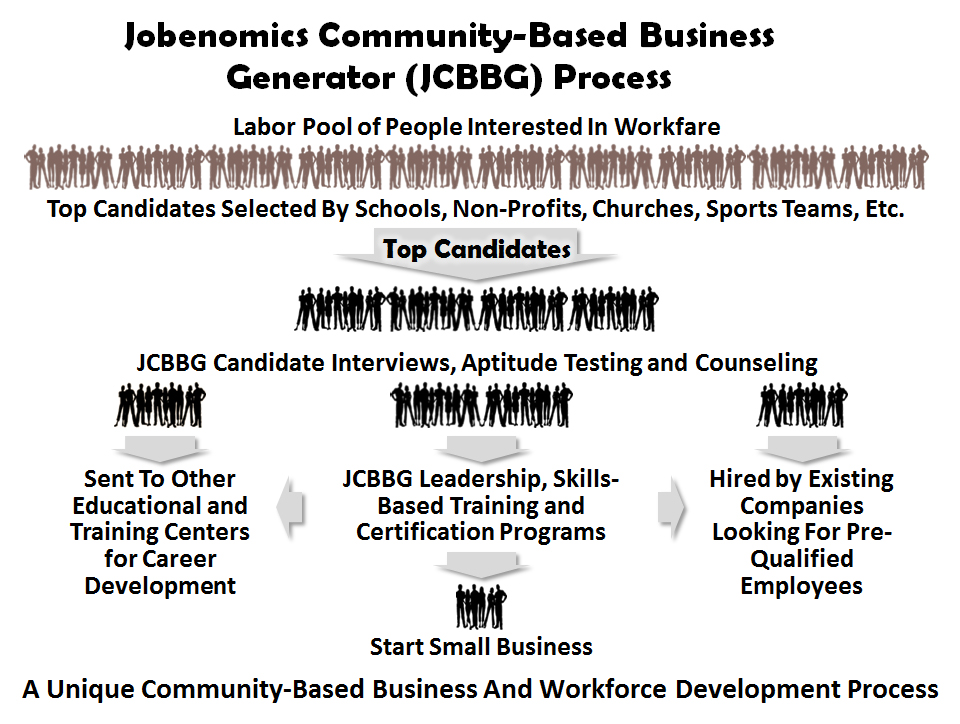
Starting with a notional pool of thousands of candidates, Jobenomics will work with local civic organizations (churches, non-profits, sports teams, etc.) to identify and nominate the top 30% to 50%, who they know, for the Jobenomics Community-Based Business Generator program.  This is the first stage of the due diligence process to separate the proverbial wheat from the chaff.

These nominees will then be subjected to standard aptitude and attitude tests in order to identify and assist those (1) those that should be sent other educational (GED and postsecondary) or training (vocational) centers for career development, (2) those that are qualified and suitable for immediate employment with existing companies, and (3) those that desire and have an aptitude for starting a small or self-employed business.  Jobenomics Community-Based Business Generator will help all people who enter the program to find meaningful employment and career paths.

Jobenomics envisions that 25% of the nominees would seek a traditional education and training path, 25% would be hired directly by existing business who are looking for quality workers, and 50% would seek a more independent and self-sufficient route offered by a small business startup or self-employment.

Of the 50% that choose the Jobenomics Community-Based Business Generator training and certification process, Jobenomics anticipates that approximately 25% will eventually implement a small business startup or incorporate as a self-employed business.  The 75% that undergoes but does complete Jobenomics Community-Based Business Generator process will be certified (with empirical data by professional testing and evaluation) as high-quality candidates for immediate employment or traditional education/vocational training.

Many of the initial candidates are likely to prefer working for existing companies rather than going through the Jobenomics process.  Anticipating this, Jobenomics will implement a “pipeline” to connect these individuals who have undergone some level of due diligence to companies that are hiring.  Consequently, the Jobenomics management team includes a nationally recognized leader who developed such a pipeline system that has matched 250,000 veterans with companies.  This system is ideally suited for matching Jobenomics candidates to local employment vacancies.

The overall objective is to mass-produce small and self-employed businesses, which makes the Jobenomics Community-Based Business Generator process unique as a traditional business and workforce development center.  Traditional workforce development processes focus on preparing potential workers for employment by existing businesses—usually large corporations.  For marginalized individuals at the base of the American economic pyramid (especially those in depressed urban and rural areas) the odds of employment at existing businesses are slim as evidenced by the long lines at traditional job fairs versus the low percentage of people hired.

The Jobenomics process focuses on preparing workers for starting a business, whether they actually start one or use the experience to be more competitive to get a job.  In today’s world, gainful employment is difficult and oriented to those that are currently employed, credentialed or high-skilled.  Conversely, a common complaint that Jobenomics often hears from companies is that they have a very hard time (1) finding good people who want to work, (2) who have the right attitudes and aptitude for work, and (3) who have workforce credentials, experience or related skills.

Every nominee that enters the Jobenomics process will setup a self-employed business, which can be incorporated in a matter of days, and undergo elementary business training.  The reason for setting up a small business is to make them more competitive in today’s job market.  Many employers prefer to “try before they buy”.  An incorporated self-employed individual can position themselves for subcontract or contingent work (1099) as a prelude to standard full-time work (W2).  Even if a self-employed individual never receives an income as a self-employed business, that individual can present themselves with credentials (Employer ID Number, website, business card and skills resume) that align with the business community.  In addition, Jobenomics will provide additional credentials regarding the individual’s workforce aptitude, skills and suitability tailored to the specific hiring opportunity.  Jobenomics credentialing, along with letters of recommendation from the nominees’ sponsoring organization, will greatly distinguish the individual from the masses of unemployed or new or returning workforce entrants.

Today, the United States does not have standardized national, state or local processes to create or mass-produce startup businesses.  The U.S. startup process is largely ad hoc.  By instituting a community-based (all jobs are local) standardized, repeatable and scalable process to mass-produce startup businesses, millions of new establishments could be created across America.  By being part of a small business team, team members will be motivated to grow the business in order to make it more profitable, which facilitates upward mobility, higher wages, better benefits, potential equity positions, and, perhaps most importantly, a sense of camaraderie and purpose.

Job creation is the number one issue facing U.S. in regard to economic growth, sustainment and prosperity.  Jobs do not create jobs, businesses do, especially small businesses that currently employ 80% of all Americans and created 80% of all new jobs since the end of the Great Recession.

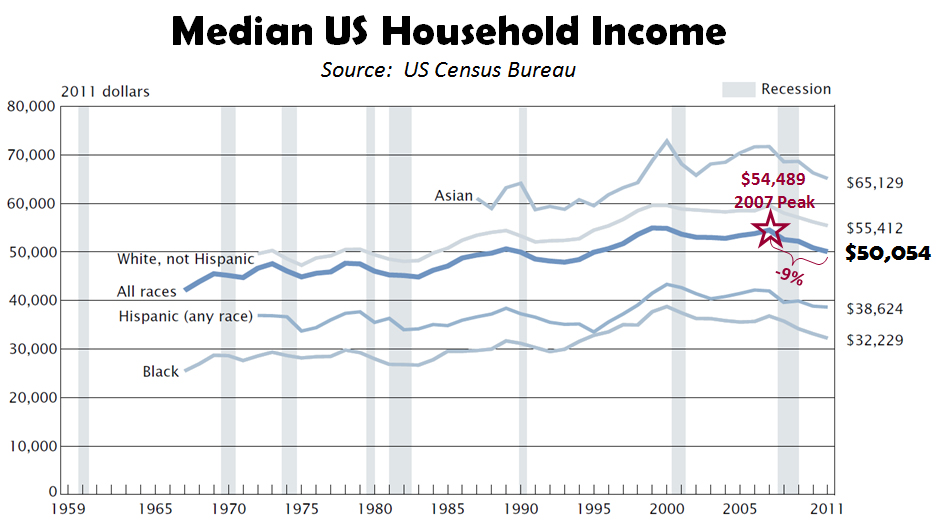
Unfortunately, America is focused on big business and government employment solutions that have not been very effective growing the U.S. labor force.  In fact, the U.S. labor force is in a state of decline as evidenced by the eroding middle-class and the transformation from standard full-time to part-time and contingency workers.  With the next fifteen years, Jobenomics forecasts that the contingent workforce will replace traditional full-time workforce as the dominant force of labor in the United States—a trend that is largely unknown to policy-makers and the American public.

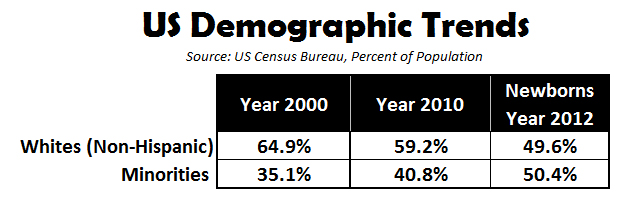
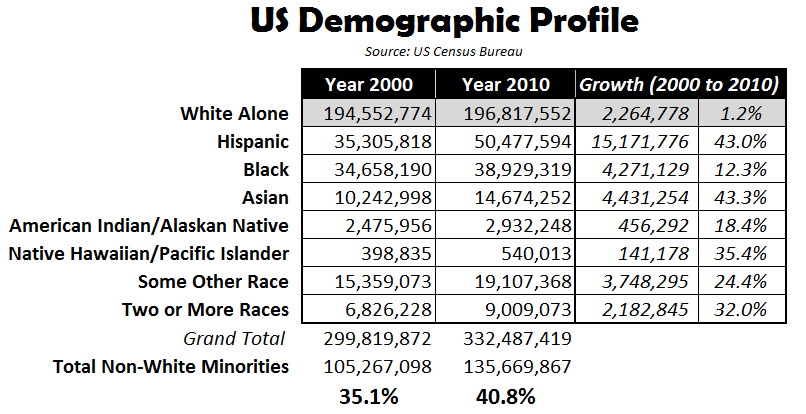
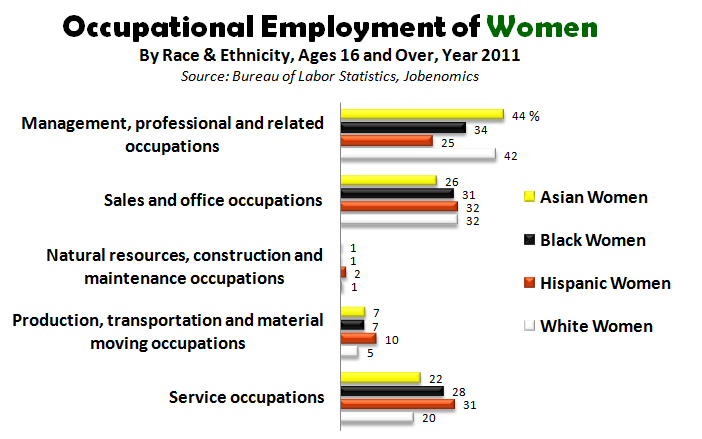
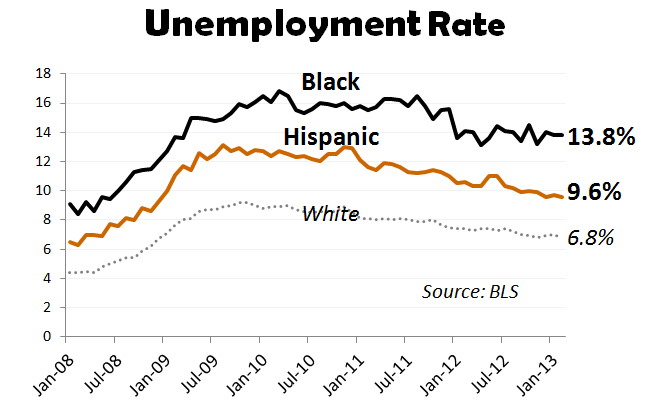
Jobenomics asserts that the four demographics with the highest need and growth potential include women, minorities, new workforce entrants, and the large cadre of financially distressed citizens who want to work or start a business.  These demographics are ideally suited for the accommodating the growing contingent workforce and attracting new labor force entrants that often do not share the same employment dream of older generations.

Jobenomics believes that new small, emerging and self-employed businesses could create 20 million new jobs within a decade, if properly incentivized and supported.   Notwithstanding filling the 5+ million open U.S. jobs positions, the emerging Energy Technology Revolution (ETR) and the Network Technology Revolution (NTR) could create 20 million net new American jobs within a decade given proper leadership and support.

Using the Jobenomics Community-Based Business Generator process of mass-producing highly repeatable and scalable “turn-key” small and self-employed businesses, America writ large could create tens of millions of jobs that would transform the U.S. labor force, middle-class and economy as well as providing hope and jobs for marginalized urban and rural American communities.


Jobenomics City & State Initiatives

Jobenomics City & State Initiatives

www.Jobenomics.com

By: Chuck Vollmer

29 July 2016

Download 16-page white paper at

Jobenomics City State Initiatives 29 July 2016

Jobenomics is now working directly with community leaders to develop business and job creation initiatives to mass-produce small businesses and jobs.  Emphasis is placed on demographics with the greatest need and potential—women, minorities and youth.  Jobenomics New York City, Jobenomics Delaware and Jobenomics Baltimore City initiatives are underway with other city and state efforts in progress.

  • Jobenomics New York City’s employment goal is for 1,000,000 net new jobs by 2026 in the five boroughs of New York City.  Jobenomics New York City is led by a Harlem community leader who is also running for Mayor of New York City. [1]
  • Jobenomics Delaware’s employment goal is for 150,000 net new jobs by 2026 across the three counties and three major cities in Delaware.  Jobenomics Delaware is led by a Dover business executive who is running for Lt. Governor. [2]
  • Jobenomics Baltimore City’s employment goal is for 100,000 net new inner-city jobs by 2026. Jobenomics Baltimore City is currently being led by a Commissioner of the Governors Workforce Investment Committee and inner-city Baltimore community leader. [3]

These community leaders are working with other community, government and business leaders to develop detailed plans, with actionable milestones, for citizens who desire meaningful jobs or want to start a business.

PowerPoint presentations for Jobenomics New York City, Jobenomics Delaware and Jobenomics Baltimore City are available as footnoted.

[1] Jobenomics New York City presentation:  http://jobenomicsblog.com/jobenomics-new-york-city/

[2] Jobenomics Delaware presentation:  http://jobenomicsblog.com/jobenomics-delaware/

[3] Jobenomics Baltimore City presentation:  http://jobenomicsblog.com/jobenomics-baltimore-city/

Jobenomics Delaware

Jobenomics Delaware Initiative (JDI)

By: La Mar Gunn, Candidate for Lt. Governor

30 June 2016

Download presentation and white paper at:

Jobenomics Delaware Presentation - 23 June 2016

Jobenomics Delaware White Paper 30 June 2016

After ten years of effort, hundreds of meetings with policy-makers, thousands of meetings with business and community leaders and an outreach effort to over two million people, many Americans believe that the Jobenomics Plan for America is the most mature and comprehensive business and jobs creation plan in the United States.  Chuck Vollmer, author and founder of the Jobenomics national grassroots movement (http://Jobenomics.com/), has joined my campaign for Delaware Lt. Governor.

Together, we developed an actionable plan to create triple the current rate of new job creation to create 150,000 net new jobs in Delaware within the next ten years.

JDI Goal

While JDI addresses big business and government employment, its principal focus is on highly-scalable small and self-employed businesses that employ 80% of all Americans and have produced 80% of all new jobs this decade.   Specifically, JDI will focus on (1) women, minorities, new workforce entrants and other hopefuls with the highest need and growth potential, (2) mass-producing startup businesses via community-based business generators, (3) attracting new highly-scalable businesses to Delaware with emphasis on filling open job positions and exploiting emerging and  new employment opportunities, (4) forming alliances with countries, cities, corporations and entrepreneurs, and (5) identifying sources of investment in order to achieve the JDI business and job creation goal.

JDI Framework

The initial JDI notional framework includes nine job creation areas for depressed urban (with emphasis on Wilmington, Dover and Newark), rural (with emphasis on agriculture and aquaculture) and coastal communities.  JDI will focus on filling current open jobs and exploiting emerging opportunities in caring services, construction, urban mining, the energy technology revolution and the fast growing digital economy.  This notional framework will evolve as community stakeholders adopt new areas for development.

The solution to growing Delaware’s economy and labor force involves putting Delaware’s small business engine into over-drive.  Therefore, the JDI team will work with community leaders to implement community-based business generators (CBBGs) that will mass produce startups, extend the “life span” of fledgling firms and accelerate existing businesses by (1) working with community leaders to identify and train high potential small business owners and employees, (2) implementing highly repeatable and highly scalable “turnkey” businesses with emphasis on the service-providing industries, (3) establishing sources of startup funding, recurring funding and follow-on contractual work to provide a consistent source of revenue for new businesses after incorporation, and (4) providing ongoing mentoring and support services.

A 50-page JDI presentation is available at www.GunnForUS.com.  If interested in joining JDI or setting up a meet to discuss this initiative, contact me at (302) 218-640.

Jobenomics-New York City

Jobenomics launches New York City initiative to create 1 million net new jobs in New York City over the next decade. This initiative is lead by Rev, Michel Faulkner, a former New York Jets NFL player, who started the Institute for Leadership in Harlem to identify and train potential small business startups in association with Jobenomics. Michel Faulkner is also a candidate for Mayor of New York and a former candidate for the U.S. Congress. (Faulkner for NYC Mayor Website at www.faulknerfornewyork.com). The following white paper describes the Jobenomics-New York City initiative.

Michel Faulkner Jobenomics Cropped

Jobenomics-New York City

By: Rev. Michel J. Faulkner

Candidate for Mayor of New York City

17 November 2015

Download PDF version: Jobenomics New York City 19 November 2015.  Jobenomics New York City White Paper 19 November 2015.

Also see: Faulkner for NYC Mayor, http://www.faulknerfornewyork.com/.

After ten years of effort, hundreds of meetings with policy-makers, thousands of meetings with business and community leaders and an outreach effort to over two million people, many Americans believe that the Jobenomics Plan for America is the most mature and comprehensive business and jobs creation plan in the United States.  Charles D. (Chuck) Vollmer, author and founder of the Jobenomics national grassroots movement, has joined my campaign for mayor of New York City.  Together, we are developing an actionable plan to create one million net new jobs in New York City within the next ten years via implementation of community-based business generators that will mass-produce tens of thousands of startup businesses.

Jobenomics deals with economics of business and job creation.  Jobenomics national grassroots movement’s goal is to facilitate an economic environment that will create 20 million net new U.S. middle-class jobs within a decade.  The movement has reached millions of people via its blog, reports, TV/radio, social media, lectures and word-of-mouth.

Research.  Jobenomics produces a series of comprehensive reports including quarterly employment and unemployment reports that address the U.S. labor force, business and economic conditions.  Jobenomics provides advice and timely data to policy-makers and decision-makers regarding business and job creation trends.

Focus Areas.  While Jobenomics addresses big business and government employment, its principal focus is on highly-scalable small and self-employed businesses that employ 80% of all Americans and have produced 80% of all new jobs this decade.  Women, minorities, new workforce entrants and the growing cadre of poor white males represent future business owners with the highest need and growth potential.

National-Level Initiatives.  Jobenomics is leading two national-level initiatives called the Energy Technology Revolution (ETR) and the Network Technology Revolution (NTR).  These initiatives could create 20 million net new American jobs within a decade.  The ETR plan addresses emerging technologies, processes, systems and services across the entire energy spectrum for electrical power generation, transportation, storage and energy-related services.  The NTR is characterized by a “perfect storm” of advanced technologies including: cloud computing, semantic webs, ubiquitous computing, advanced networks, machine learning, robotics, credentialing, Internet-of-Things and artificial intelligence agents.   The NTR plan addresses America’s transition from a traditional to a digital economy and the transformational impact that the NTR will have on the economy, institutions, businesses and the labor force.

J-NYC Plan 1 Million Net New Jobs By 2026

Jobenomics New York City (J-NYC):  The J-NYC team is currently operating out of the Institute for Leadership facilities in Harlem (http://www.institute4leadership.com/).  The initial draft of the J-NYC plan will be completed by mid-2016, depending on ongoing consensus building activities and community participation, and will be a “living” document with actionable and measurable milestones built on the framework of Jobenomics Plan for America. The J-NYC plan focuses on (1) NYC demographics with the greatest need and potential, (2) mass-producing startup businesses via community-based business generators, (3) attracting new highly-scalable businesses to NYC with emphasis on the network-centric and e-commerce firms, (4) forming alliances with countries, cities, corporations and entrepreneurs and (5) identifying sources of investment in order to achieve the one million net new jobs goal.

The J-NYC Business and Job Creation Plan’s objective is to quadruple the historical rate of NYC new job creation (232,000 per decade) with a goal of one million net new livable wage jobs by 2026.   The plan concentrates on (1) implementing community-based business generators throughout the NYC metropolitan area, (2) developing workforce skillsets to fill vacant NYC jobs, (3) exploiting employment opportunities with the largest and fastest growing NYC industries, (4) implementing new business and job creation initiatives tailored to the needs of New Yorkers and (5) positioning the NYC labor force for substantial opportunities generated by energy and network technology revolutions.

J-NYC Community-Based Business Generator (J-CBBG) Concept.  The solution to growing the NYC economy and labor force involves putting NYC’s small business engine into over-drive.  Therefore, the J-NYC team will work with borough leaders to implement community-based business generators that will mass produce startups, extend the “life span” of fledgling firms and accelerate existing businesses.   J-CBBGs will (1) identify and train potential small business owners and employees, (2) implement highly repeatable and scalable businesses with emphasis on the service-providing industries, (3) establish sources of startup funding, recurring funding and contracts to provide a consistent source of revenue for new businesses and (4) provide ongoing mentoring and support services.

Filling Open NYC Job Vacancies.  As of November 2015, NYC’s five boroughs had 44,790 job vacancies.[1]  40,240 or 90% of the open positions are related to ten occupations: management, computer services, business and financial, sales, office support, healthcare, entertainment, social services, transportation and food services.  Corporations with the largest number of open vacancies were Capital One, JP Morgan Chase, Oracle, King Teleservices and Deloitte with a total of 6,129 open positions. J-CBBGs will work with companies and occupational associations that have a vested interest in fulfilling these vacancies via training or certifying viable candidates with a specific skillset, or starting new businesses that can provide tailored services as subcontractors.  The J-CBBGs will work with selected non-profits, such as employment-related institutions and churches (three Harlem mega-churches with over 250,000 parishioners have already agreed to support the J-CBBG concept), to perform the initial candidate due diligence.  J-CBBGs will conduct further evaluations (Jobenomics and The Institute for Leadership already perform testing of this sort) to determine if candidates are ready for employment and capable of starting their own small business (self-employed, home-based, e-commerce, contractor, franchise, etc.).  J-CBBGs will also build teams of future employees and future startup owners to increase camaraderie, accountability and successful launches.

Largest and Fastest Growing NYC Sectors

Exploiting Employment Opportunities with the Largest and Fastest Growing NYC Sectors and Businesses.  When preparing a labor force for maximum employment, J-NYC will begin with the largest and fastest growing sectors. NYC employs 4,191,500 workers.  542,000 (13%) work for government and 3,648,900 (87%) for the private sector.   J-NYC’s business and job creation effort concentrates, but not exclusively, on private sector service-providing industries that are the largest (82%) employers of New Yorkers and the fastest growing segment (2.1%) of the major employment sectors.  While the goods-producing segment (manufacturing, construction, mining) are vitally important, J-NYC feels that there is sufficient attention already being given to this segment that has limit upside employment potential as compared to services.

Within the NYC service-providing sector, the largest and fast growing industries are: Education and Health Services (866 million employees, 2.5% growth in the last year);   Professional and Business Services (687M, 2.1% growth); Trade, Transportation and Utilities (631M, 1.4% growth); Financial Activities (459M, 1.9% growth); Leisure and Hospitality (427M, 3.2% growth) and Accommodation and Food Services (340M, 2.3% growth).[2]  As a result of this data, J-NYC will work with NYC-based associations and companies in each of these industries to determine the level of interest and support for the J-NYC plan and their desire to engage with J-CBBG sponsorship, employee training and business startups.   From our initial conversations with various corporate leaders, there is a keen interest in “feeder” facilities that can provide certified job candidates and independent contractors.  Many would prefer to subcontract than hire.

New J-NYC Business and Job Creation Initiatives.  J-NYC’s outreach program has already started identifying potential stakeholders for business and job creation initiatives for those struggling to make a livable wage.  Most stakeholders say that they are eager to support any viable workfare over welfare initiatives.   As the J-NYC plan matures new initiatives and programs will be added to the ones currently being pursued by J-NYC.  J-NYC’s top three job creation initiatives are The Leadership Training Program, Urban Mining and Direct Care Centers.

  • The Leadership Training Program is underway at the Institute for Leadership (IFL) and producing solid results. This program trains, empowers, and partners with leaders and organizations that are already in the community including church leaders, business executives, government officials, athletic coaches and others who function in positions of leadership.  The program also is working with leaders on health reform, financial management and entrepreneur training.  Perhaps, the greatest benefit of this program is that J-NYC has a solid base of community leaders willing and eager to support the maturing J-NYC plan.
  • Urban Mining involves monetized urban waste streams such as municipal solid waste (MSW), construction and demolition material, tires and electronic waste. Waste is comprised of organic and nonorganic materials that can be reclaimed as commodities.  J-NYC advocates a zero landfill/export policy and programs that convert waste into fertilizers, energy, biofuels and valuable raw materials.  Jobenomics created eCyclingUSA LLC (http://ecyclingusa.com/) to help communities reclaim high value metals from electronic waste and use profits (average $30 million per year) for jobs and business creation.  A typical eCyclingUSA plant can produce $30 million in profit and employ several hundred people.  J-NYC is currently pursuing efforts to locate multiple eCyclingNYC facilities throughout the NYC metro that will hire the disadvantaged and formerly incarcerated.
  • Direct Care Centers are oriented to training and starting home-based, self-employed businesses that provide in-home eldercare, healthcare and childcare services. Direct Care is ideal for struggling households run by women who are looking for work or supplemental income to support their families.  One of the biggest reasons that single mothers are struggling financially is due to the cost of childcare.  Direct Care centers can help free many single mothers to join the workforce by training and supervising other single mothers to care for a neighbor’s children for a fraction of the cost of other services.   Direct Care Centers can also provide personnel and contract workers to large organizations, like New Partners, a subsidiary of Visiting Nurse Service of New York.  The Direct Care Center concept is the next logical step in IFL’s health reform effort.

Energy Technology Revolution (ETR).  The ETR will create hundreds of millions of jobs globally and millions for cities, like NYC, that embrace transformative energy technologies, processes, systems and services.  Using Jobenomics’ comprehensive ETR report as a baseline, J-NYC is developing a strategy for the greater NYC metropolitan area in regards to the economic impact and employment potential of the ETR.  For electrical power generation, J-NYC will evaluate the impact and challenges of cleaner fossil fuels, renewables, grid-level systems, point-of-use systems, greenhouse gas emissions, power density, storage, next-generation technologies, and investment.  J-NYC also plans to form alliances with sister cities in California, Japan, China and Germany that are embracing their versions of the ETR.  For example, Tokyo’s metropolis is similar to NYC in terms of power density and energy issues.   Consequently, it would be prudent to take advantage of any Tokyo’s successful ETR pursuit that could fulfill a NYC energy need.  For example, Tokyo Gas plans to install 2,500,000 energy efficient miniature point-of-use natural gas fuel cells in homes and apartments for power and heat generation.  NYC can also learn from Germany’s Energiewende (German for energy transition) national initiative to transition Germany from fossil and nuclear fuels to renewable energy,  California’s 2030 goal of having 50% of its electrical generation from renewables, and China’s extensive research in next generation ETR technology.  In the transportation area, sister cities in these countries are leading the way in advanced vehicles, alternative fuels and advanced storage systems that could be applied to shaping the NYC energy ecosystem.  In energy services sector, energy efficiency, energy conservation, energy security and Energy-as-a-Service (EaaS) businesses are growing at phenomenal rates and fertile areas for employment and startups.  Over the last five years, the Institute for Leadership has participated in Jobenomics initiatives in the energy services sector including energy audits, weatherization and solar installation certification training.  As a result, the IFL team believes that Jobenomics ETR plan is solid and will provide an excellent baseline for the J-NYC ETR plan, consensus building and collaborative engagement.

Network Technology Revolution (NTR).  The NTR will create literally billions of new jobs globally as the digital economy takes root.  Today, in terms of e-commerce, the overall U.S. economy is 5% digital and growing at 20% per year.  The United Kingdom leads the world with a 12% digital economy followed by South Korea at 8% and China at 7%.  China’s strategy to become the world’s leading digital economy is as breathtaking as it is comprehensive.  China is attempting to replicate its manufacturing miracle of lifting 400 million people out of poverty in two decades by implementing a combined public/private e-commerce strategy to lift an equal amount of rural Chinese out of poverty by 2030.   Alibaba Group, a Chinese conglomerate that recently (2014) had the largest Wall Street IPO in history, is positioning itself to be a global e-commerce leader by financing the creation of 10 million new Chinese network-centric microbusinesses.  Other Chinese conglomerates and government institutions are pursuing similar efforts.   J-NYC plans to collaborate with countries and companies like these, as well as U.S. corporate giants like Amazon, Google, Apple and Microsoft to help NYC create businesses and jobs in the rapidly growing digital economy.  J-NYC is in the process of identifying hundreds of emerging companies that have the potential to create jobs and small businesses in the same way that Uber (cars for hire), AirBNB (rental accommodations) and WeWork (office space) has accomplished.  Founded in 2010, WeWork is now the fastest-growing consumer of office space in 15 “high IQ” cities and is one of the largest office space providers in NYC.  The NTR also has a very dark side.  According to recent studies, computer automation can eliminate as much as 47% of the U.S. labor force in the next two decades.   Automation has been replacing manual labor for years, but via the NTR cognitive skill jobs are increasing at risk.  If there is any doubt just ask Apple’s Siri, Amazon’s Echo or IBM’s Watson.   The J-NYC NTR plan will seek to mitigate potentially massive NYC labor force departures (due to automation or voluntary departures) by creating highly-scalable new jobs and businesses that can compete and prosper in the digital economy.  The J-NYC NTR team will also work with existing businesses to adapt and harness the power of new NTR technologies, processes, systems and services to compete and prosper more effectively.

Funding.  J-NYC will pursue various sources of funding.  The Institute for Leadership has an initial bank pledge of $20 million for micro-business loans up to $50,000 for each new J-NYC small business created.  Other potential sources of funding include government bonds, debt/equity financing, corporate sponsorships, crowd funding and impact investing.  Impact investing refers to investments made to organizations that generate a measurable, beneficial social impact.  Socially conscious investing has grown in popularity with family foundations, philanthropic organizations, endowments, pensions, hedge funds, mutual funds and other financial institutions like Blackrock and Bain Capital.  NYC has a plethora of “top 1%” organizations and philanthrocapitalists (philanthropists who see themselves as social investors) that could be encouraged to underwrite J-CBBGs for their service to the public good as well as their public relations value to their organizations.

Contact.  The J-NYC team is interested in community leaders that are interested in workforce and small business development as outlined herein.  Please contact me or the J-NYC team at 212.690.7748 and the address is 245 W. 135th Street, New York, NY 10030.

[1] New York State Department of Labor, Labor Statistics, 9 November 2015,  https://www.labor.ny.gov/stats/nyc/

[2] New York State Department of Labor, Current Employment Estimates, https://labor.ny.gov/stats/lscesmaj.shtm

Minority-Owned Businesses

Download PDF Version: Minority-Owned Businesses - 10 Jan 2014

Minority-Owned Businesses

www.Jobenomics.com

By: Chuck Vollmer

10 January 2014

Executive Summary.   Today, there are 6 million minority-owned businesses in the US.  Jobenomics advocates a national goal of 18 million by year 2020—a goal that is achievable and necessary.  Race and ethnicity are important elements of America’s economic equation.  Jobenomics forecasts that income opportunity (see Income Inequality versus Opportunity posting) will become a leading domestic issue as minorities assert their growing demographic, economic and political power.    Racial and ethnic minorities currently constitute 40.8% of the US population, and are responsible for approximately $3 trillion worth of America’s expenditures and consumption for goods and services (see Consumption-Based Economy posting).   This degree of economic power could fuel the creation of millions of minority-owned businesses that would provide income opportunity for millions of Americans.

US Demographic Trends

US Minority Demographic Trends.  Today, minorities comprise about 41% of the US population, but will be in the majority much sooner than most people recognize.   According to the US Census Bureau[1], for the first time in American history, most (50.4%) American children younger than age 1 are now racial and ethnic minorities.  Consequently, America could be a generation away from being a minority-majority nation—perhaps quicker, considering aging baby-boomers and low birth rates in the White-majority.   California (60.3% minorities), Texas (55.2%), New Mexico (59.8%) and Hawaii (77.1%) are already minority-majority states.

 US Demographic Profile

According to 2010 Census data[2], the largest minority group is Hispanics and Latinos (Hispanic) with 50.5 million people, followed by African-Americans (Black) with 38.9 million, Asian-Americans (Asian) with 14.7 million, American and Alaskan Natives with 2.9 million, Native Hawaiian and Other Pacific Islanders with 0.5 million, and “Some Other Race” with 19.1 million.  An additional 9 million Americans identified themselves as multi-racial from two or more races.  196.8 million Americans identified themselves as non-Hispanic Whites (White)—a 59.2% majority compared to a minority population of 40.8%.

Between 2000 and 2010, the White population grew by 2.3 million or 1.2%.   Asians and Hispanics were the fastest-growing groups by percentage, or 43.3% and 43.0% respectively.   The Hispanic population increased by 15.2 million between 2000 and 2010, accounting for half of total US population growth.   Blacks grew at a rate of 12.3% for a total gain of 4.3 million over the decade.  Asians added 4.4 million during this period.  All other minority groups grew by 6.5 million at a combined rate of 26%. 

Minorities in the US Labor Force.   The US Department of Labor’s Bureau of Labor Statistics (BLS) recently completed a landmark study[3] regarding US labor force characteristics by race and ethnicity[4].  The three major minority groups that the BLS studied were Black, Hispanic and Asian.   The following charts were created by Jobenomics using data from the BLS study to compare these major US minority groups’ employment and income characteristics to those of Whites.  While important, smaller minority groups (American Indian, Alaskan Native, Native Hawaiian, Other Pacific Islanders, and people who identified themselves as multi-racial or from some other race) are not included in this analysis due to limited numbers (only 2.5% of the US labor force).

The US Civilian Labor Force includes all working-age persons who are employed or unemployed and looking for a job.  In 2011, the US civilian labor force was 153.6 million out of a total population of approximately 309 million.   Whites dominated the US labor force with 67% (103.3 million workers) of all workers, followed by Hispanics with 15% (22.9 million), Blacks with 11% (17.1 million) and Asians with 3% (4.7 million).

As shown in the following series of charts, employment in the five major occupational categories is more equally distributed between races/ethnicities than the 67% manpower advantage would imply.

 Median Weekly Earnings By Occupation

As shown above, the five major occupational categories range from management on top, to service on the bottom in terms of median weekly earnings[5].  Based on these five categories, the three major minority groups fared reasonably well against the White majority as indicated in the following charts.

 Occupational Employment of Men

As a percentage of their group, Asian men (49%) were the most likely to be employed in the top category of “management, professional and related occupations” compared to Whites (35%), Blacks (24%) and Hispanics (16%).  In “sales and office occupations” all four groups were relatively equally represented (17%, 18%, 15% and 17%).  “Natural resources, construction and maintenance occupations” were dominated by Hispanics and Whites.  “Production, transportation and material moving occupations” as well as “service occupations” were led by Blacks and Hispanics over Whites and Asians by 22% versus 14% of their respective work forces.

 Occupational Employment of Women

As a percentage of their group, Asian women (44%) were the most likely to be employed in the top category of “management, professional and related occupations” compared to Whites (42%), Blacks (34%) and Hispanics (25%).  In “sales and office occupations” all four groups were relatively equally represented (26%, 31%, 32% and 32%).  Women were not a major contributor by employment in the “Natural resources, construction and maintenance occupations” category.  “Production, transportation and material moving occupations” were relatively equal amongst all women subgroups with Hispanic women having a slight edge.   “Service occupations” were relatively close amongst all women subgroups with Hispanics (31%) followed by Blacks (28%), Asians (22%) and Whites (20%).

It is important to note that these two Occupation Employment charts are calculated as a percentage of their group, as opposed to a percentage of total employed, which, as discussed earlier, is dominated (67%) by Whites.   For example, Asian-male participation in the “management, professional and related occupations” category is better represented by 49% (percentage of their group) than 5.4% (percentage of the total employed) as reported by other BLS surveys[6].   49% reflects that almost half of all working Asian-males are involved in management and professional occupations—an impressive percentage.  5.4% indicates only a small number of Asians are in management and professional occupations compared to the total working population—an unimpressive percentage—that does not account for the fact that the total number of Asians only represents 1/20th of the US work force.  Consequently, major minority groups are faring much better regarding labor force participation than the media and political activists often portray by using percentage of total employed statistics.

Income and Unemployment Inequities.   While Jobenomics asserts that minority groups fare much better in the US labor force than generally perceived, Jobenomics also acknowledges that there are inequities that need to be fixed, especially in the Hispanic and Black subgroups.

 Median US Household Income

According to the most recent US Census Bureau report[7], US median household income has fallen by 9% since 2007, hurting all Americans regardless of race or ethnicity.  Today, the US Asian community maintains the highest median household income of $65,129, followed by Whites ($55,412), Hispanics ($38,624) and Blacks ($32,229).

 Employment-Population Ratio

Over the decades, income inequality has remained relatively the same between the races, collectively increasing during good times, and collectively decreasing over bad times.  During the good times, income inequality was not a politically-charged issue since increasing household income provided a sense of well-being.  Since year 2000, the US Employment-Population Ratio has decreased 9.4% with the greatest impact on the middle-class.  During the last six years, the precipitous decline in household income significantly impacted the Black and Hispanic communities that were especially hard-hit during the Great Recession, largely due to the mortgage crisis and the erosion of middle-class jobs.  As shown above, over the last three years, the Employment-Population Ratio has flatlined, causing considerable anxiety and discord regarding limited income opportunity.

 Unemployment Rate

Since the Great Recession, unemployment increased for all Americans, but the Black and Hispanic groups were hit the worst, with current unemployment rates[8] at 13.8% for Blacks and 9.6% for Hispanics, compared to 6.8% for Whites and 5.1% for Asians (not shown on chart due to limited historical data).

Youth unemployment is even more egregious, especially for Black youths aged 16 to 19 years old, which is 38.2% compared to 20.5% for Whites[9].

In summary, Jobenomics concludes that, institutionally, minority groups are not having a major issue with participation.  The Asian minority group is doing quite well exceeding White participation in top paying occupations.  While Black and Hispanic groups lag behind Whites in participation, they are not lagging by a great extent.  On the other hand, Blacks and Hispanics are challenged by their concentration in lower labor categories, high unemployment rates and depressed household incomes.

Minority-Owned Businesses.   From a Jobenomics perspective, the primary solution to enhancing minority labor force participation and increasing wealth in minority communities involves minority-owned business creation, which is growing at twice the rate of all US business.  If America exploits this trend, millions of minority-owned businesses could be created providing many millions of jobs.

U.S. Census Bureau performs a Survey of Business Owners twice each decade.  A survey was conducted in 2007 and the results released in 2011—the latest data available.  A survey was conducted in 2012, but the results will not be released until 2015.

Highlights of the 2007 Survey of Business Owners [10] include:

  • In 2007, more than one-fifth (21.3%) of the nation’s 27.1 million firms were minority-owned.
  • In 2007, minority-owned firms numbered 5.8 million, up from 4.0 million in 2002, an increase of 45.5%—more than double the 17.9% increase for all US businesses. Receipts of minority-owned firms increased 55.0% to $1.0 trillion over the five-year period, compared with the 32.9% increase for all businesses nationwide.
  • Of the 5.8 million minority-owned firms, 766,533 had paid employees, an increase of 21.7% from 2002. These firms employed 5.8 million people, a 24.4% increase from 2002, and their payrolls totaled $164.1 billion, an increase of 42.2%. Receipts of minority-owned employer firms totaled $860.5 billion, an increase of 54.3% from 2002.
  • In 2007, minority firms with no paid employees (mainly self-employed businesses and partners of unincorporated businesses) numbered 5.0 million, an increase of 50.0% from 2002. These firms had receipts totaling $164.3 billion, an increase of 58.9%.
  • Black-owned businesses grew to 1.9 million firms in 2007, up 61% from 2002 - the largest increase among all minority-owned companies; and generated $135.6 billion in gross receipts, up 53% from 2002.  Black-owned firms accounted for 7.1% of all US businesses and employed 921,032 persons.
  • The number of Hispanic-owned businesses totaled 2.3 million (8.3% of all US businesses) in 2007, up 44% from 2002. Receipts for Hispanic firms increased 55% to $343.3 billion.
  • Asian-owned firms grew 41% from 2002 to 1.6 million. Asian-owned firms continue to generate the highest annual gross receipts at $510.1 billion in 2007, increasing 56% from 2002.

Jobenomics believes that doubling or tripling minority-owned businesses from 5.8 million to 11.6 million or 17.4 million is very achievable within a decade—if American communities implement viable plans that emphasize highly-scalable small, emerging and self-employed business creation.

Jobenomics Minority-Owned Business Creation Initiatives.   Over the last two years, Jobenomics met with minority leaders in dozens of cities to discuss minority-owned business, wealth creation and meaningful jobs creation.  These cities include Harlem (NY), Washington DC, Atlanta, Detroit, Chicago, Phoenix, Fort Worth, Philadelphia, San Diego, Las Vegas, Honolulu, Greensboro (NC), Wilmington (DE), Roanoke (VA), Chester (PA) and Bridgeport (CT).  What we learned was encouraging—even in the most financially depressed inner-cities.

It was encouraging to find a high degree of entrepreneurial spirit and willingness to create minority-owned business.  However, most government and community leaders have relatively little business experience, especially with start-ups and self-employed businesses.  To compensate for inexperience, they tend to look to Washington or big-business that has not produced any net new jobs in the last several decades.  Jobenomics contends that the most reliable source of guidance resides in innovators and serial-entrepreneurs.  Various governmental small business agencies and associations do an adequate job of counseling and providing grants, but have little expertise in mass-producing highly-scalable small businesses.

The Father of American Education, Horace Mann, stated that “education is the great equalizer of the conditions of men, the balance-wheel of social machinery.”  While Jobenomics agrees, the educational paradigm in yesteryear was much different than today.  The old paradigm, “get an education to get a job…get a better education to get a better job” simply does not work in today’s high-tech, slow-growth economy where middle-class jobs are increasingly outsourced overseas.  Most citizens in inner-cities need basic skills as opposed to higher education.  If 40% of college graduates have difficulty finding jobs, how can a high school dropout hope to find work?

From a Jobenomics perspective, basic skills include communication, tradecraft and business.  For inner-cities, Jobenomics focuses first on business creation.  Small businesses offer the fastest way out of poverty through employment for the unemployed.  Every city should have a community-based business generator that mass produces highly-scalable businesses.  Our second priority is tradecraft—a skill acquired through experience in a trade—with emphasis on skilled service businesses.  The third area is communications.  In a business sense, communications entails the ability to express and demonstrate one’s value-proposition.

Jobenomics Community-Based Generators (1) identify and train potential business leaders and business owners, (2) implement highly repeatable and scalable businesses with emphasis on service-providing businesses, (3) establish sources of start-up funding, recurring funding and contracts to provide a consistent source of revenue for new businesses, and (4) provide post start-up business support.

Many metropolitan areas have business incubators that are oriented to emerging high-tech and manufacturing businesses.  These incubators are often located in affluent areas or high-tech corridors.  Jobenomics offers a complementary concept that focuses on business generators that are oriented towards trade-level, service-providing businesses in economically-depressed areas.  Rather than incubating innovative business opportunities one-by-one, a business generator mass produces highly-scalable, start-up businesses.  When fully operational, the community-based generator will be capable of creating 1,000 new small businesses per year.

Jobenomics has three fledgling Jobenomics Community-Based Generator projects underway in College Park (Atlanta), Harlem (New York City) and Detroit.  Jobenomics is in the process of establishing networks of local non-profit and educational institutions to identify entrepreneurial talent.  Once identified, the Community-Based Generator will evaluate candidates via self-employment surveys (see initial self-employment survey at www.Jobenomics.com) and counseling to determine their suitability for business ownership and the type of business.

Following the evaluation phase, candidates will undergo a training, certification and implementation process.  Classes will be taught by successful small business owners and entrepreneurs with expertise in startup business implementation.   By the end of the program the clients will have:

  • An Employer Identification Number (EIN), incorporation (S-Corp, C-Corp or Limited Liability Corporation), and the essentials to run a fully functional company (accounting systems, business plans, legal/regulatory, branding/marketing/sales, financing, etc.).
  • A computer supplied with accounting, business planning and website/social networking systems.  Training will also be provided including how to obtain appropriate accounting (e.g., bookkeeping and CPA), information technology, and sales/marketing/ advertising/branding support after graduation from the center.
  • Supplementary business systems (e.g., website, social networking, bank accounts, etc.) that will facilitate the promotion of the new business.
  • Understanding on how to access government grants and investment capital.
  • A network of entrepreneurial organizations and on-going business support.

eCyclingUSA-JobenomicsJobenomics founded eCyclingUSA™ (www.ecyclingUSA.com) as part of its green-jobs initiative and a way to fund community-based business generators in metropolitan areas.  Each month, city managers give away millions of tons of whiteware (e.g., appliances) and other electronic waste (computers and televisions) that contain tens of millions of dollar’s worth of minerals (e.g., copper, aluminum, precious metals) that can be reclaimed, sold on the commodities market or used to develop local industries.  eCyclingUSA technology is in operation in 60 plants across Europe.  eCyclingUSA plans to implement 50 sites across the US and is committed to donating a minimum of 10% of its annual profits (between $1 and $3 million per year per site) to fund Jobenomics Community-Based Business Generators.


[1] US Census Bureau, Most Children Younger Than Age 1 are Minorities, 17 May 2012, http://www.census.gov/newsroom/releases/archives/population/cb12-90.html

[2] US Census Bureau, 2010 Census Briefs, Overview of Race and Hispanic Origin: 2010, March 2011, Table 1.  Population by Hispanic or Latino Origin and by Race for the United States: 2000 and 2010, http://www.census.gov/prod/cen2010/briefs/c2010br-02.pdf

[3] US Department of Labor, Bureau of Labor Statistics, Labor Force Characteristics by Race and Ethnicity 2011, Report 1036, published August 2012 and updated 6 June 2013, http://www.bls.gov/cps/cpsrace2011.pdf

[4] Note: the BLS reports monthly on White, Black and Asian groups but not Hispanics. Consequently, this 2011 report provides the latest official US government “apples-to-apples” comparisons of all four groups.

[5] BLS, Median weekly earnings by race, ethnicity, and occupation, first quarter 2012, http://www.bls.gov/opub/ted/2012/ted_20120419_data.htm

[6] BLS, Household Data Annual Averages, Table 11, Employed persons by detailed occupation, sex, race and Hispanic or Latino ethnicity, Year 2012 (retrieved 12 Sep 2013), http://www.bls.gov/cps/cpsaat11.pdf

[7] US Census Bureau, Income, Poverty, and Health Insurance Coverage in the United States: 2011, by Carmen DeNavas-Walt, Bernadette D. Proctor and Jessica C. Smith, http://www.census.gov/prod/2012pubs/p60-243.pdf, issued September 2012

[8] BLS, Unemployment rate by age, race, and Hispanic or Latino ethnicity, January 2008–February 2013, http://www.bls.gov/opub/ted/2013/ted_20130312.htm

[9] BLS, Table A-2 Employment status of the civilian population by race, sex, and age, September 2013, http://www.bls.gov/news.release/empsit.t02.htm

[10] US Census Bureau, 2007 Survey of Business Owners, http://www.census.gov/econ/sbo/

Income Inequality versus Opportunity

PDF Version: Income Inequality versus Opportunity 26 November 2012

26 November 2012

There is a significant difference between income inequality and income opportunity.  Income inequality represents a rearward view on how much money a person possesses at a given time.  Income opportunity represents a forward view of wealth potential and upward social mobility.   Jobenomics recognizes income inequality as a starting point, but focuses on income opportunity, via business and job creation, especially at the base of America’s economic pyramid.

Income Inequality.  Income inequality is defined as unequal distribution of household or individual income across the various participants (regional, social, racial, gender) in an economy. Income inequality slows economic growth, reduces social mobility, causes financial conflicts and creates discord.  A survey for the World Economic Forum identified growing income inequality as one of the world’s most pressing issues for the next decade.  After a period of wane, income inequality is growing again in America.  US income inequality is often associated with income fairness and is now a dominant issue for policy-makers, media and social activists.

Much of the $6 billion dollars spent on the 2012 US election process focused on income inequality, especially rich (top 1%) versus middle-class and poor (the bottom 99%).  Inflammatory rhetoric and political attack ads offered few solutions but exacerbated our political divide. A recent New York Times article[1], entitled Look How Far We’ve Come Apart, addressed the severity of the political divide in our country.   Polarization between our two main political parties (shown below) has grown to the point of political paralysis.                                                                                                                                                                    

The article also indicates that the US public is similarly divided,
almost to the extent that America was divided prior to the American Civil
War.  The media are also polarized.  America has reached a crossroads where the left wing no longer believes anything the right as to say, and vice versa.  Now that the 2012 elections are history, the world is anxiously watching to see if America can reverse course and unite as a nation to address our strategic challenges. If we continue to focus on income inequality, America will continue to divide politically, socially and economically.  The word “inequality” is
divisive, implying inadequacy and disparity.  We cannot unify by using words, slogans and data that create dissension.

Conventional wisdom asserts (1) that income inequality is always bad, and (2) the United States is one of the most inequitable distributors of income on the planet.  Both of these assertions are not accurate.

Income inequality is not a condition that we should tolerate, but is a myth that it is always bad.  Throughout history, income inequality has been a powerful motivator.  The American Revolution had issues of income inequality at its roots.   Today, many of the greatest American success stories are about people from humble beginnings.  Some degree of income inequality can be tolerated as long as a corresponding degree of income opportunity exists.  Individuals and businesses would not innovate without the opportunity to reap rewards.  When opportunity exceeds inequality, people are generally optimistic and motivated to succeed.  However, when inequality exceeds opportunity, people are unhappy and motivated towards discordance.  Unfortunately, America has entered a period where inequality exceeds opportunity, which places the US economy at risk.

Regarding the assertion that America is inherently inequitable, let’s take a strategic view of income inequality using official US government data, which is footnoted for the reader.  Household income is generally used as the standard measure of income wealth by US government agencies.   US household income includes the income of the householder and all other individuals 15 years old and over in the household.  Household income is defined as income received on a regular basis not including capital gains or non-cash benefits (food stamps, health benefits, subsidized housing, and most other forms of welfare or entitlement benefits).  “Median” household income divides the total number of households and families (including those with no income) into two equal parts.

According to the US Census Bureau, 95.7% of US households (multiple incomes) make less than $200,000 and 49.8% make less than $50,000.  $50,000 represents the median US household income.  The US poverty line is approximately $15,000 depending on the number of people in the household.   These groups are usually defined as “middle-class” or “poor”.

The “the rich” are usually defined by personal income categorized in percentiles: top 5%, top 1%, and the ultra-rich.  To qualify for an entry level position in the top 5%, a person needs to earn an annual income of $150,000.  $340,000 is needed for the top 1%.  An ultra-rich person in the top 0.1% starts at $1.5 million.  An ultra-rich person in the top 0.01% starts at $8 million.

US median household income has fallen substantially this decade—the first such decline since the Great Depression in the 1930s.  The Median US Household Income chart, from the 2012 US Census Bureau report[2],  shows that median US household income started decreasing prior to the Great Recession.  In 2007, the median US household income for all races peaked at $54,489.  In 2011, it was $50,054, for a loss of $4,435, or 9%.  All races suffered a decline over the same period, but the US Asian community continues to have the highest median household income of $65,129, followed by Whites ($55,412), Hispanics ($38,624) and Blacks ($32,229).  Over the decades, income inequality has remained relatively the same between the races, collectively increasing during good times, and collectively decreasing over bad times.  During the good times, income inequality was not a politically-charged issue since increasing household income provided a sense of well-being.  During the last five years, declining household income has produced anxiety and discord.

The US Federal Reserve reports[3] on income inequality using the Income Gini Ratio (also called the Gini Index or Gini Coefficient) by race.  The Gini Ratio is defined as a measurement of income distribution that ranges from 0, representing perfect equality, to 1, representing prefect inequality.  As shown, Black Americans suffer the worse inequality within their own race.  In other words, the distance between rich and poor within the Black community is greater than the distance in other races.  The Hispanic community is the most homogeneous in terms of household income.  Whites and Asians are in the middle with the Asian community having volatile swings during the decade.

A number of international organizations, like the World Bank and International Monetary Fund, use the Gini Ratio to define income inequality among nations.  The Global Income Inequality chart (above) was created by Jobenomics using US Central Intelligence Agency data listed in their widely-accessed World Factbook’s Distribution of Family Income-Gini Index[4], which was compiled by the CIA using data from various international institutions.  As far as global income inequality, the United States ranks slightly above average.  The world’s worst income inequality is in emerging and totalitarian countries.  Industrial and democratic countries are much more equitable in terms of income inequity.  Globalization has narrowed the income inequality between nations but has exacerbated income inequality within nations due to global competition, international supply chains, global capital markets, and new information technology.

The data that gets most political and media attention is from the US Census Bureau’s Income Inequality Historical Tables[5].  The Census Bureau reports historical income inequality data in current dollars (not adjusted for inflation) and inflation adjusted dollars.

The US Historical Income Inequality chart was created by Jobenomics using Census 2011 dollars (adjusted for inflation) over the last 45 years.  Over the last 4 ½ decades, the bottom 95% of US households have not made significant income gains.  The top 5% average household income increased from $111,866 in 1967 (note: unadjusted 1967 household income for the top 5% was $19,000) to $186,000 in 2011 for a gain of 66%, or 1.5% per year— significant but certainly not great.  To get to great numbers, one must use top 1% or top 0.1% data that is addressed below.


 Here is the same chart showing current dollars that are not adjusted for inflation.   In current dollars the top 5% increased their average household income by 879% ($19,000 in 1967 to $186,000 in 2011) as opposed 66% ($111,866 in 1967 to $186,000 in 2011) using 2011 Dollars that were adjusted for inflation.  Jobenomics believes that inflation adjusted dollars give more of an apples-to-apples comparison, than non-adjusted current dollar comparisons.

Jobenomics created the Top 1% chart using the most recent bipartisan US Congressional Budget Office report[6], updated August 2012 (note: the US Census Bureau does not report on the top 1%).  The chart shows that the top 1% far exceeds all other taxpayer incomes.  In 2009 Dollars, the top 1% earned an average after-tax income of $886,700 down from $1,120,500 a year before the recession.  The CBO also reports that there are 1.1 million top 1% households out of a total of 117.6 million US households, and that their share of total after-tax income was 11.5%.  In other words, the top 1% represents 1% of all households and earns 11.5% of total US income.

There is no US government data that regularly reports on ultra-rich income.  However, much antidotal data is available.   The average CEO of the top US companies make $13 million per year, not counting stock options.  By some accounts, the top 25 hedge fund managers make as much as all the top S&P 500 CEOs.  These managers make billions, not millions, per year.  From a global perspective, while Americans consider millionaires and billionaires to be rich, there are many areas of the world where personal wealth is measured in billions and trillions.  In oil rich Arab nations, baby-sheikhs (20 year olds) are worth tens of billions of dollars and their fathers are trillionaires.

The 2012 presidential campaign debated the merits of increased taxation on the wealthiest American.  Using Congressional Budget Office data[7], if taxes were increased by 5% on the top 1%ers, as requested by President Obama, approximately $60,985 more would be paid by each of the 1.1 million 1%ers.  The net result would be approximately $69 billion dollars in new tax revenue, which is a relatively insignificant compared to $1 trillion annual deficit spending.  Since $69 billion is only 7% of $1 trillion, the other 93% would have to come from increased taxes on the middle-class or reductions in spending.  If taxes were increased all Americas in the top 20%, the net result would be $264 billion, or 25% of our annual spending deficit.   It should be noted that the lower end top 20%ers (81st to 90th percentile) do not feel that they are wealthy, especially if the average $131,700 household income is a dual income family (e.g., husband and wife) each earning $65,850.

Income Opportunity.  Income opportunity involves money that people can earn as opposed to money that they have.  The term opportunity implies favorable conditions or prospects in order to attain advancement or success.  Today, the American dream of upward mobility, fairness and optimism has been shaken in the wake of a Great Recession, chronically high unemployment and a stagnant economy.

Income opportunity is directly influenced by socio-economic mobility.  Socio-economic mobility is the movement of an individual or group from one income level to another.  Socio-economic mobility can be upward or downward.  In America, with a few exceptions, mass upward socio-economic mobility has been the general trend since the creation of the United States.  Most people that enter US workforce from high school or college move from initial lower paying jobs to higher paying careers.  Those that dropout of school or society are likely to entrench themselves in the lowest income quintile with much lower mobility.  While welfare and unemployment payments provide a safety net for those in the lowest quintile, these payments tend to trap these same individuals in low quintiles by eroding their socio-economic mobility.  The longer a person is out of the workforce, the harder it is for that person to get a meaningful job.  Socio-economic mobility is also influenced by education and social status.  A presentation by Assistant Treasury Secretary Jan Eberly at the 2012 Economic Measurement Seminar produced an insightful graphic on intergenerational socio-economic mobility[8]:

According to Sec. Eberly, higher education is critical for economic mobility.  Without a college degree, children born in the bottom income quintile have a 45% chance of remaining there as adults.  With a degree, they have a roughly equal chance of attaining each income quintile, which means an 80% chance of being in a higher income quintile than their parents.

While America has always been know as the “land of opportunity”, the Great Recession and chronically high unemployment has eroded socio-economic mobility for those at the base of America’s economic pyramid.  A 2012 study[9] by the Economic Mobility Project of the Pew Charitable Trusts states while “Eighty-four percent of Americans have higher family incomes than their parents did….Those born at the top and bottom of the income ladder are likely to stay there as adults.   More than 40 percent of Americans raised in the bottom quintile of the family income ladder remain stuck there as adults, and 70 percent remain below the middle”.

Jobenomics believes that high school dropout rates, especially in the inner cities, is symptomatic of a greater problem—the lack of income opportunity.  Jobenomics is working with local leaders in Detroit, Harlem, Atlanta, Washington DC and a number of smaller communities, all of whom say that high dropout rates are directly related to the lack of jobs.  Why graduate from school when meaningful opportunities are not available?   Jobenomics defines meaningful opportunities more in terms of careers as opposed to jobs.  To most young people, minimum wage jobs are not meaningful as compared to income opportunities derived from illicit employment or government welfare benefits.  Consequently, Jobenomics emphasizes community-based business generators in order to mass produce thousands of micro-businesses in the inner city.  Micro-businesses provide meaningful income opportunity.

Many Americans feel that Washington policy-makers can fix our problems.  Jobenomics disagrees for a number of reasons.  First, a stagnant economy as well as a deeply divided citizenry  makes political consensus-building difficult.  Second, the biggest challenges for improving income opportunity are beyond Washington’s reach.  Thirdly, global competition in the digital age levels the playing field for 6 billion other people around the world who want income opportunity and are often more motivated to strive to get it.  While Washington has an important support role, it is up to the private sector to create businesses and jobs.

Since the beginning of this decade, small business has created 66% of all new jobs in America.

A recent McKinsey report[10] entitled Restarting the US Small-Business Growth Engine accurately describes small business as the engine of US economic growth with emphasis on “high growth” small businesses.  The McKinsey article states that “a subset of small businesses—high-growth ones—creates the vast majority of new jobs. Seventy-six percent of these high-growth firms are less than five years old. The 1 percent of all firms that are growing most quickly (fewer than 60,000 in all) account for 40 percent of economy-wide net new job creation.”   The biggest challenge for the McKinsey model is picking winners.  It is hard to identify the next generation serial entrepreneurs, like Bill Gates (Microsoft), Steve Case (AOL), Mark Zuckerberg (Facebook) and Meg Whitman (eBay). Therefore, the McKinsey model focuses on small businesses that already have established themselves with potentially high growth products or services. McKinsey also advocates big business and government assistance to help emerging businesses grow rapidly and mass produce jobs.

Jobenomics focuses on “highly scalable” start-up businesses that are unlikely to receive significant government and big business support.  Jobenomics is currently working on the establishment of a dozen community-based business generators that will mass produce small and self-employed businesses that can be replicated easily.  Self-employed businesses (both incorporated and unincorporated) are a good example of the type of highly scalable business that can be mass produced in order to create millions of jobs. The Jobenomics model focuses on individuals that have a yearning to start a business.  Jobenomics is currently concentrating on four demographics: inner city minority groups (service-providing businesses that focus on journeyman skill sets), women-owned businesses (direct-care, direct-sales and education/training businesses), Generation Y (start-up businesses that focus on monetizing social networks and the internet) and veterans-owned businesses (businesses that specialize in defense industry related occupations).  These demographics have the potential for 10s of millions of jobs and millions of new businesses that can be replicated across America.

In conclusion, income distribution is relatively well divided in the US even though a majority of Americans believe otherwise.  So why are Americans so upset about income inequality when official government data indicates otherwise?  For America to prosper, the answer lies with income opportunity, not income inequality.

Today, too few are paying for too many.  Only 32% of our population financially supports the rest of our population.  We have a moral obligation to provide a safety net for the 23 million looking for work and the 70 million that cannot work.  We also have an economic imperative to grow the private sector work force that currently consists of 102 million people.  The Jobenomics goal is 20 million new private sector jobs by year 2020.  The Jobenomics national grassroots plan is designed to unite a divided nation through business and job creation with emphasis on small, emerging and self-employed businesses in the middle and bottom of America’s economic pyramid.  Providing meaningful income opportunity is essential to sustaining the American dream of mass upward social mobility.


[1] The New York Times, The Opinion Pages, Look How Far We’ve Come Apart, by Jonathan Haidt and Marc J. Hetherington, http://campaignstops.blogs.nytimes.com/2012/09/17/look-how-far-weve-come-apart/, 17 Sep 12

[2] US Census Bureau, Income, Poverty, and Health Insurance Coverage in the United States: 2011, by Carmen DeNavas-Walt, Bernadette D. Proctor and Jessica C. Smith, http://www.census.gov/prod/2012pubs/p60-243.pdf, issued September 2012

[3] US Federal Reserve Bank of St. Louis, http://research.stlouisfed.org/fred2/graph/?id=GINIBAF,GINIWANHF,GINIHARF

[4]  CIA World Factbook, Distribution of Family Income-Gini Index, https://www.cia.gov/library/publications/the-world-factbook/fields/2172.html

[5] US Census Bureau, Historical Income Tables: Income Inequality, H-1 All Races, http://www.census.gov/hhes/www/income/data/historical/inequality/

[6] Congressional Budget Office, Distribution of Household Income (Supplemental data spreadsheet), updated 10 August 2012, http://www.cbo.gov/publication/43373

[7] Ibid

[8] US Department of the Treasury, Remarks of Assistant Secretary Jan Eberly before the National Association of Business Economists (NABE), 2012 ECONOMIC MEASUREMENT SEMINAR, 31 July 2012,  http://www.treasury.gov/press-center/press-releases/Pages/tg1662.aspx, and http://www.treasury.gov/press-center/press-releases/Documents/View%20the%20charts%20shared%20with%20NABE%20today.pdf, Page 6

[9] Economic Mobility Project of the Pew Charitable Trusts, Pursuing the American Dream: Economic Mobility Across Generations, 9 July 2012, http://www.pewstates.org/research/reports/pursuing-the-american-dream-85899403228

[10] McKinsey & Company, McKinsey Quarterly, “Restarting the US small-business growth engine”, by John Horn and Darren Pleasance (Strategy Practice), November 2012, http://www.mckinseyquarterly.com/Strategy/Growth/Restarting_the_US_small_business_growth_engine_3032

Women-Owned Businesses

From a Jobenomics perspective, women are the greatest untapped asset in
America.  The women-owned business initiative is paramount in the Jobenomics 20 million new private sector jobs by the year 2020 campaign (20 by 20).

Jobenomics’ emphasis is on women-owned businesses, as opposed to women-in-business.  The US has approximately 18,000 big businesses, 6 million small businesses, and 22 million self-employed businesses.  While there is nothing wrong with women pursuing opportunities in big business, Jobenomics believes that most women will find greater opportunity and satisfaction by creating their own small, self-employed business, tailored to their individual lifestyles. In comparison, today’s highly competitive corporate workspace tends to require employees to conform to corporate culture, which can conflict with other roles women may juggle, such as caring for children or aging parents.

The 2010’s is certain to be the Decade of Women-owned businesses. (1) The Great Recession has encouraged many women to join the workforce, due to necessity or desire, of which many are college educated. (2) Male-dominated industries, like construction and manufacturing, aren’t likely to return to normal until the end of the decade. (3) Social norms are changing, allowing greater participation of women in business. (4) Many of the future service-related jobs, like elder-care, are likely to be dominated by women. (5) Women-owned businesses emphasize small businesses, rather than large, and are more likely to experience growth in the next decade. (6) The traditional “nuclear” families, with a male-head of household, have given way to households headed by women. (7) Most importantly, the rate of employment growth and revenue of women-owned businesses has outpaced the economy and male-dominated businesses for the last three decades.

Today, there are approximately 10 million women-owned businesses that employ 23 million direct and indirect employees, or 22% of the US private sector civilian workforce.  9 million women-owned firms are self-employed businesses without employees.  If each women-owned business hires one additional person this decade, 10 million new jobs would be produced.  This would equate to 10 million direct jobs—half the 20 by 20 goal.  The jobenomics effort intends to help create the conditions that will motivate and incentivize growth of women-owned firms.

Jobenomics is working with several leading women’s organizations (Women’s Information Network, Women’s Radio, and California Leading Ladies) to help define women-owned business initiatives in areas like direct-selling, direct-care, cloud computing, and women veterans’ small businesses.  The Jobenomics Community-Based Business Generators will feature a number of programs that will facilitate creation of women-owned businesses.

The Women’s Information Network: http://thewinonline.com

Women’s Radio:  http://www.womensradio.com

California Leading Ladies: http://www.leadingladiesconference.com & www.EventComplete.com