Jobenomics Trends & Forecasts
Creating new businesses creates new jobs
-
Monthly GDP & Jobs Report: November 2018
The U.S. economy is growing briskly. The rate of GDP growth in 2018 is more than double the rate of ... -
Monthly GDP & Jobs Report: October 2018
Record highs and record lows indicate that the U.S. economy is booming and the U.S. labor force is waning. GDP ... -
GDP & Jobs Report
The August 2018 employment report is nothing to celebrate. Jobenomics asserts that the media hoopla regarding 201,000 new U.S. jobs ... -
U.S. Construction Situation Report
To say the American construction industry is booming is an understatement. So far this decade, the U.S. Construction supersector’s 3.3% ... -
U.S. Manufacturing Employment Report
The U.S. Manufacturing supersector is vitally important to national sovereignty and an anchor tenant of the U.S. economy. Re-shoring and ... -
GDP & Jobs Report
While U.S. GDP growth is improving significantly, the latest employment reports indicate marginal labor force improvement. Consequently, the U.S. economy ... -
4.1% GDP Growth
Bravo to the Trump Administration for achieving a 4.1% GDP growth rate in the second quarter (Q2) of 2018. The ... -
Trade War? (Updated)
Free trade is an ideal goal. In practice, reciprocal trade is more realistic, especially in an ever-changing global marketplace. After ... -
Gig/Contingent Economy
Even though Jobenomics estimates that the size of the U.S. contingent workforce is four-times greater than reported in the June ... -
Jobs & GDP Report 1 June 2018
The latest U.S. Bureau of Labor Statistics and ADP Research Institute employment reports for May 2018 indicate that the United ... -
Comprehensive U.S. Labor Force & Employment Report: Q1 2018
While highly-advertised statistics (e.g., the stock market, official unemployment rate, and consumer confidence index) suggest that the U.S. economy is ... -
Business Tax on Homelessness?
Chuck Vollmer explains why Seattle’s $275 per employee tax on local businesses to pay for the homeless is wrongheaded from ... -
Disappointing Jobs & GDP Report
The latest U.S. Bureau of Labor Statistics and ADP Research Institute employment reports for April 2018 indicate that the United ... -
Jobs & GDP Report
The March 2018 U.S. Bureau of Labor Statistics and ADP Research Institute reports indicated that the United States created only ... -
US-China Trade War
Is President Trump starting a trade war with China or is he reacting to a trade war that has been ... -
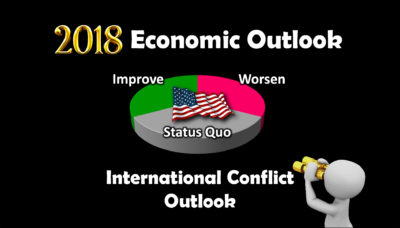
International Conflict Outlook
The Jobenomics 2018 U.S. Economic Outlook predicts an equal probability for economic improvement, maintaining the status quo or an economic ... -
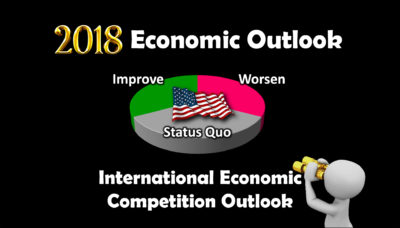
International Economic Competition Outlook
The Jobenomics 2018 U.S. Economic Outlook predicts an equal probability for economic improvement, maintaining the status quo or an economic ... -
Jobenomics Jobs & GDP Report
U.S. labor force added 313,000 new jobs in February, which is positive news regarding President Trump’s bold job creation goal ... -
Civil Unrest & Natural Disaster Outlook
The Jobenomics 2018 U.S. Economic Outlook predicts an equal probability for economic improvement, maintaining the status quo or an economic ... -
Income & Wages Outlook
The Jobenomics 2018 U.S. Economic Outlook predicts an equal probability (33.3%) for economic improvement, maintaining the status quo or an ... -
Network & Digital Technology Outlook
Domestic Disruptors: Technology. The Jobenomics 2018 U.S. Economic Outlook predicts an equal probability (33.3%) for economic improvement, maintaining the status ... -
Fiscal and Monetary Policy Outlook
Governance: Trump Administration, Fiscal Policy (Congress) and Monetary Policy (The Fed). The Jobenomics 2018 U.S. Economic Outlook predicts an equal ... -
Trump Administration’s Governance Challenge
Governance: Trump Administration, Fiscal Policy (Congress) and Monetary Policy (The Fed). The Jobenomics 2018 U.S. Economic Outlook predicts an equal ... -
U.S. Not-in-Labor-Force Outlook
Labor Force: Employment, Unemployment and Not-in-Labor-Force Assessment. The Jobenomics 2018 U.S. Economic Outlook predicts an equal probability (33.3%) for economic ... -
U.S. Unemployment Outlook
Labor Force: Employment, Unemployment and Not-in-Labor-Force Assessment. The Jobenomics 2018 U.S. Economic Outlook predicts an equal probability (33.3%) for economic ... -
U.S. Employment Outlook
Labor Force: Employment, Unemployment and Not-in-Labor-Force Assessment. The Jobenomics 2018 U.S. Economic Outlook predicts an equal probability (33.3%) for economic ... -
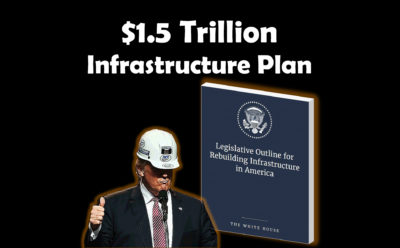
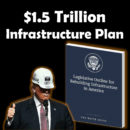
$1.5 Trillion Infrastructure Plan
On 12 February 2018, President Trump presented a 53-Page legislative outline to Congress entitled “Legislative Outline for Rebuilding Infrastructure in ... -
U.S. Startup Business Outlook
Business: Big, Small, Micro, and Startup Business Assessment. The Jobenomics 2018 U.S. Economic Outlook predicts an equal probability (33.3%) for ... -
U.S. Small & Micro-Business Outlook
Business: Big, Small, Micro, and Startup Business Assessment. The Jobenomics 2018 U.S. Economic Outlook predicts an equal probability (33.3%) for ... -
U.S. Big Business Outlook
Business: Big, Small, Micro & Startup Business Assessment. The Jobenomics 2018 U.S. Economic Outlook predicts an equal probability (33.3%) for ... -
Economy: Consumer Confidence, Debt & Deficits, and Inflation
Economy: Consumer Confidence, Debt & Deficits, and Inflation. The Jobenomics 2018 U.S. Economic Outlook predicts an equal probability (33.3%) for ... -
Economy: GDP Growth and Stock Markets
Economy: GDP Growth and Stock Markets. The Jobenomics 2018 U.S. Economic Outlook predicts an equal probability (33.3%) for economic improvement, ... -
2018 U.S. Economic Outlook
Overview (Part 1 of 7): Jobenomics deals with the economics of small business and job creation. In addition to our ... -
State of the U.S. Economy January 2018
The Trump Administration’s bold economic and job creation vision (i.e., sustained 4% GDP growth and 25 million new jobs) is ... -
Net Neutrality
The Federal Trade Commission’s repeal of network neutrality is bad for small businesses and will hurt the Administration’s plan to ... -
Bitcoin Bubble
The cryptocurrency market bubble is likely to burst causing Bitcoin and the other 1,354 traded cryptocurrencies to crash. (Download this ... -
Q3 2017 U.S. Labor Force & Unemployment Report
Download free 115-page Jobenomics Comprehensive U.S. Labor Force & Unemployment Report Q3 2017 – 31 October 2017. While U.S. stock market, ... -
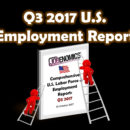
Q3 2017 U.S. Employment Report
Download free 175-page Jobenomics Comprehensive U.S. Labor Force & Employment Report Q3 2017 - 31 October 2017. While highly-advertised statistics ... -
Corporate Tax Cuts
Tax reform is an American imperative, as our system outdated and is a major factor of sclerotic rates of economic ... -
Jobenomics Monthly Employment & GDP Report
Executive Summary. The Trump Administration’s bold economic and job creation vision (i.e., sustained 4% GDP growth and 25 million new ... -
Tax Reform
Tax Reform is Trump’s signature initiative that underpins his bold vision of sustained 4% GDP growth and 25 million new ... -
Gender Pay Gap
The gender pay gap is a highly-charged political and social issue. Unfortunately, few Americans fully understand the data behind gender ... -
Jobenomics Employment & GDP Report: 9 October 2017
Executive Summary. The Trump Administration’s bold economic and job creation vision (i.e., sustained 4% GDP growth and 25 million new ... -
Paris Climate Accord?
In December 2015, the Obama Administration committed to the Paris Climate Accord to reduce toxic greenhouse gases and reduce “economy-wide” ... -
Merit-Based DACA?
Download complete article: Merit-Based DACA - 7 September 2017 The Deferred Action for Childhood Arrivals (DACA) program was established by an ...