Jobenomics Employment Report: Q1 2015
http://Jobenomics.com
By: Chuck Vollmer
1 April 2015
Jobenomics tracks both unemployment (Jobenomics Unemployment Scoreboard: Q1 2015) and employment (Jobenomics Employment Scoreboard: Q1 2015). Download PDF versions: Jobenomics Unemployment Report - Q1 2015 & Jobenomics Employment Report - Q1 2015 (This Posting)
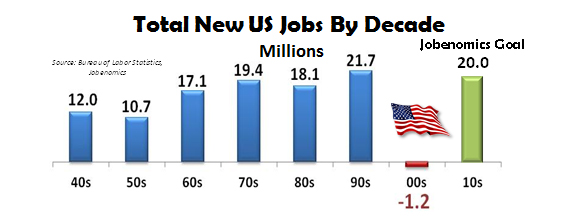
The US consistently produced tens of millions of new jobs for six consecutive decades. Then the bottom fell out in the decade of the ‘00s with a loss of 1.2 million jobs. Consequently, it is critical that significant numbers of jobs are created this decade (’10s) for the US economy to prosper. 20 million new jobs by year 2020 is a reasonable goal that is supported by the Jobenomics National Grassroots Movement. Not only has 20 million been historically achieved, but is the number needed to accommodate 16 million new labor force entrants per decade and to reduce unemployment to achieve the so-called “full employment” rate of 5%. Based on a goal of 20 million jobs by 2020, the US economy is progressing steadily upward, producing 11.5 million new jobs by the end of Q1 2015—53% through the decade producing 58% of the 20 million jobs. Based on this statistic, the US economy is well on the way to recovery. However, this is not the full story. Economic fundamentals are still largely unsustainable.
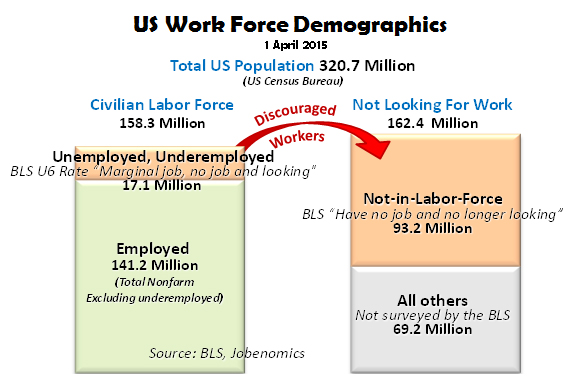
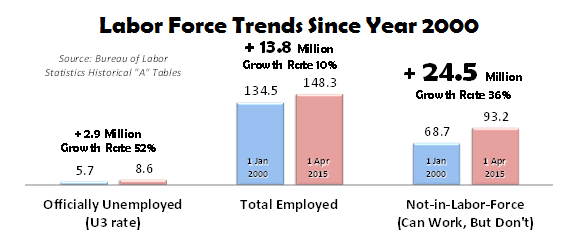
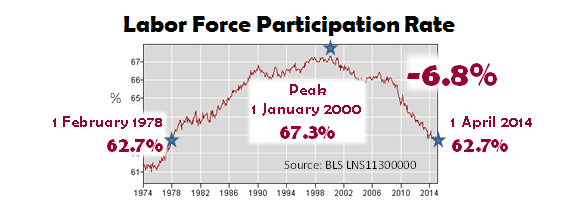
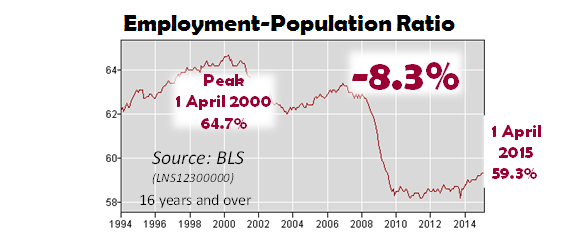
Today, America’s work force is characterized by (1) a historically-high number of able-bodied citizens who voluntarily left the labor force, (2) a historically-high number of people that work part-time, and (3) historically-low employment-to-population ratios and labor force participation rates.
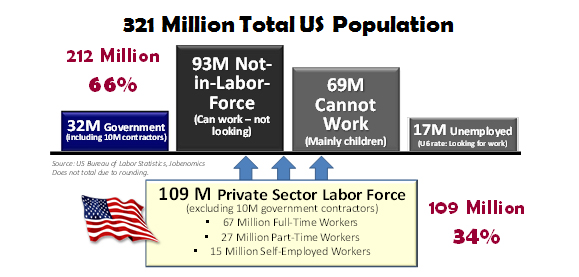
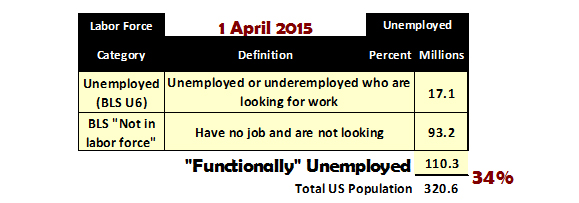
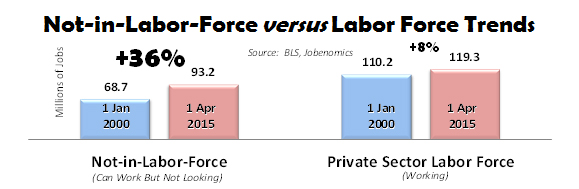
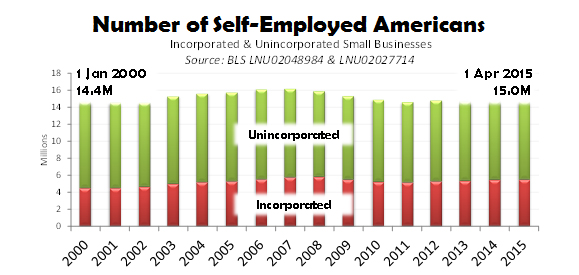
34% of all Americans financially support the rest of the country. As of the end of Q1 2015, out of a total population of 321 million Americans, 109 million private sector workers support 32 million government workers and government contractors, 17 million unemployed (U6 rate), 93 million able-bodied people who can work but chose not to work, and 69 million who cannot work. Of the 109 million, approximately 67 million individuals work full-time, 27 million are part-timers (less than 35 hours per week) and 15 million are self-employed. The US economy cannot be sustained by 34% supporting an overhead of 66%. More people must be productively engaged in the private sector labor force for the US economy to flourish.
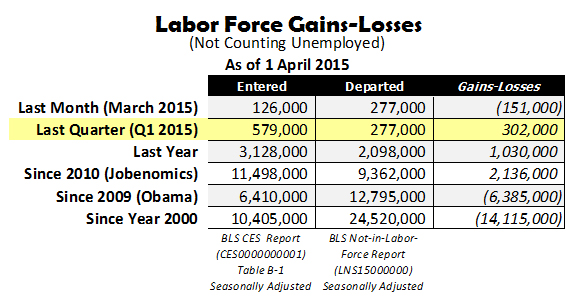
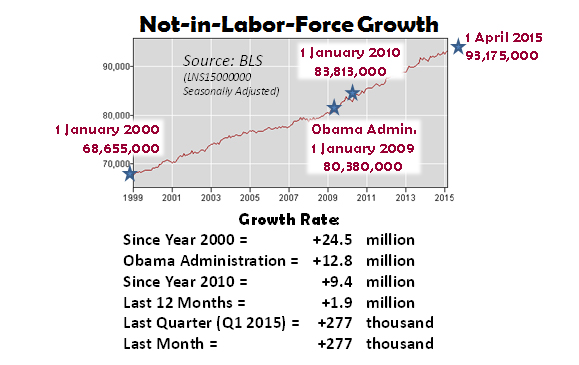
According to Bureau of Labor Statistics (BLS)[1] data, last month (March 2015) 151,000 more people departed than entered the US labor force reversing the positive trend earlier in Q1 2015. During Q1 2015 (January, February and March), a total of 579,000 people entered the US labor force and 270,000 voluntarily departed, for a net gain of 302,000—a positive trend that has followed similar employment gains of 2,136,000 jobs since the being of this decade. However, employment gains still have a long way to go. Since the beginning of the Obama Administration, 6,410,000 entered the labor force as compared to 12,795,000 who departed for a net loss of 6,385,000. Since year 2000, 10,405,000 people entered compared to 24,520,000 people who departed—many to a netherworld of perpetual unemployment and welfare—for a net loss of 14,115,000 jobs.
As discussed herein, jobs creation involves business creation, especially small business creation. In this decade, US small businesses (less than 500 employees) created 78.0% of all new jobs. During March 2015, US small businesses created an astounding 90% of all new jobs. Today, small businesses employ 77.8% of all private sector Americans with a total of 92.7 million employees—almost 5 times the amount of large corporations (1000+). Very small businesses with less than 19 employees employ 68% more than all large corporations combined (30.7M versus 18.3M). Contrary to popular opinion, 50% of all small business startups last five years and 30% remain in business over ten years. In addition, small business growth has outperformed medium and large businesses during the recovery from the Great Recession.
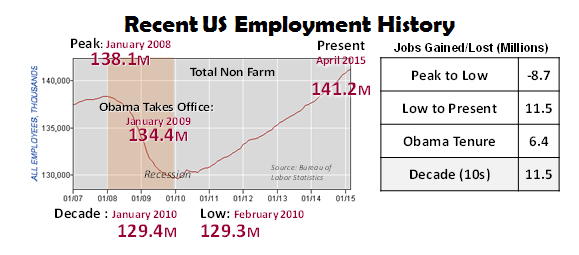
Peak US employment occurred in January 2008 with 138.1 million employed. The Great Recession low occurred in February 2010. Today, US employment reached a new peak of 141.2 million. The good news is that the 8.7 million jobs lost during the Great Recession have been recovered. While this is very positive news, employment growth has been anemic and much more needs to be done to ensure economic sustainment.
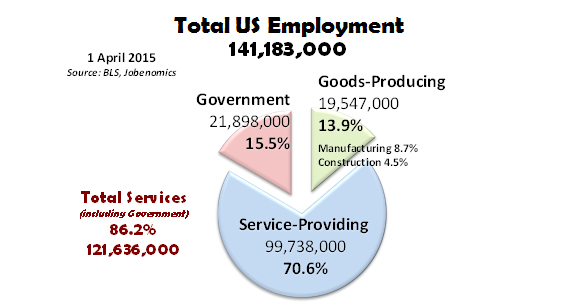
Of the 141.2 million employed Americans, 70.6% work in seven private sector service-providing industries. The seven service industries are: Professional and Business Services, Education and Health Services, Financial Activities, Trade/Transport/Utilities, Leisure and Hospitality, Financial Activities, Information, and Other Services. 13.9% are employed in private sector goods-producing industries that include Manufacturing, Construction and Mining/Logging (including Oil and Gas). 15.5% Americans work for government at the federal, state and local levels.
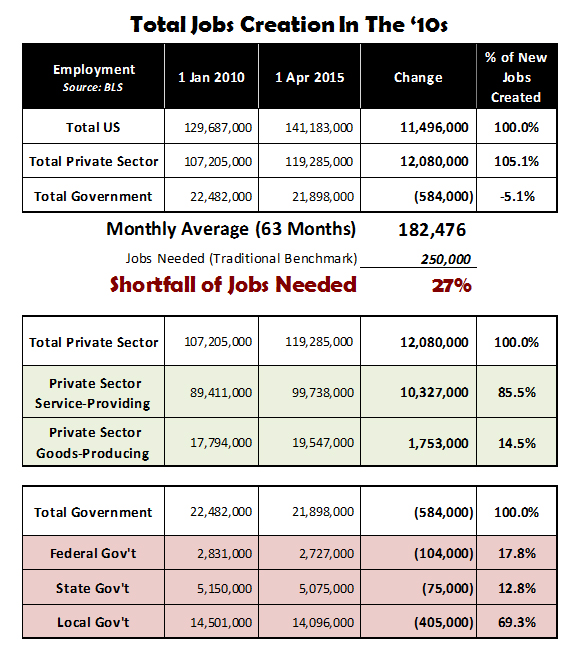
While the US economy has enjoyed employment growth as of Q1 2015, America produced only 73% (27% shortfall) as measured against the traditional benchmark of 250,000 jobs per month advocated by most economists. Note: Jobenomics goal of 20 million new jobs per decade only requires 167,000 jobs per month.
Since the beginning of this decade, the US private sector created 12,080,000 jobs compared to government agencies (federal, state and local) that lost 584,000 jobs, for a net gain of 11,496,000 jobs.
Within the private sector, service-providing industries created 10,327,000 jobs (85.5%) compared to the goods-producing industries with 1,753,000 jobs (14.5%).
Within the government sector, local government lost the majority of jobs (405,000 or 69.3%), mostly teachers, firefighters and police. Federal and state governments lost 104,000 (17.8%) ad 75,000 (12.8%) respectively.

The 30-year trend in US employment gain has overwhelmingly been in the service-providing industries with a 30-year growth rate of 76%. Government employment has also grown significantly at a rate of 37%. However, as discussed in this posting, government employment has decreased in the last several years and is likely to continue to do so. US goods-producing industries have declined 14% during the last thirty years.
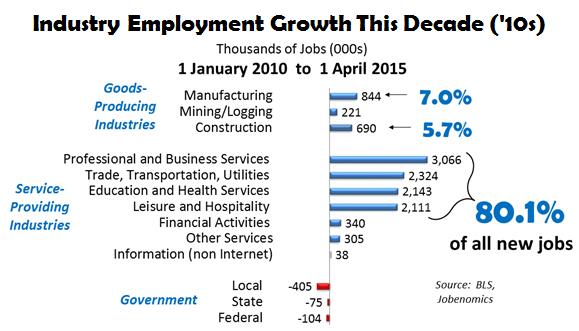
As of the end of the Q1 2015, all US private sector industries created jobs, where all levels of government (federal, state and local) government lost jobs. 80.1% of all net new jobs this decade were produced by four service-providing industries (Professional and Business Services; Trade, Transportation, Utilities; Education and Health Services; and Leisure and Hospitality). Manufacturing and Construction contributed 7.0% and 5.7% to US employment growth, respectively.
Private Sector Businesses by Company Size. The following charts examine private sector businesses by size. As reported by the ADP National Employment Report (published monthly by the ADP Research Institute in close collaboration with Moody’s Analytics), small business is the dominant American economic force in terms of employment and job creation. The ADP report is obtained by surveying 400,000 US businesses.
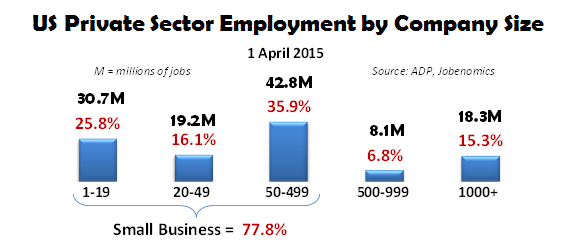
Today, small businesses (those companies with less than 500 employees as defined by the US Small Business Association, whereas ADP generally identifies small business as companies with 1-49 employees) employ 77.8% of all private sector Americans with a total of 92,673,000 million employees—over 5 times the amount of large corporations (1000+). Very small businesses with less than 19 employees employ 68% more than all large corporations combined (30.7M versus 18.3M).
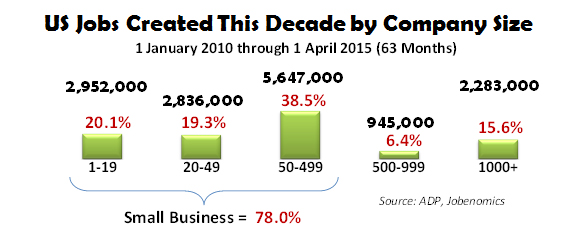
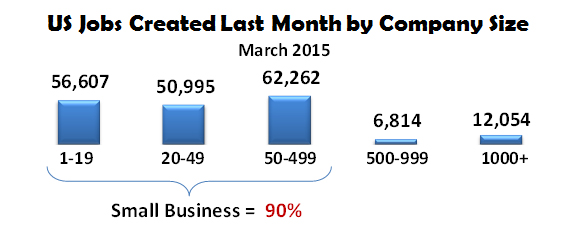 Since the beginning of this decade, small business produced 78.0% of all new American jobs. Last month’s small business jobs creation performance produced an astounding 90.0% of all new jobs. These are amazing statistics considering the adverse lending environment by financial institutions, mounting government regulation, and the pittance of federal government spending on small business creation.
Very small and startup businesses have traditionally been the primary source of employment for entry-level workers and the long-term unemployed. Had the US government paid more attention to this category of employers during its generous handouts of $17 trillion worth of federal government stimuli, bailouts and buyouts to financial institutions and large corporations since the Great Recession, as many as ten million more Americans would be employed today as estimated by Jobenomics.
According the US Small Business Administration[2], there are 28.4 million small businesses compared to 17,700 large businesses (over 500 employees). Of the 28.4 million small businesses, 5.7 million had employees and 22.7 million were nonemployers (incorporated and unincorporated self-employed, sole proprietorships, etc.). Small business startups, minus closures, create about 63% of American net new jobs. About half of all new small businesses survive five years or more and about one-third of these start-ups survive 10 years or more. In 2014, 79% of all startups survived the first year. The top three small business industries with the most jobs include Healthcare and Social Assistance, Accommodation and Food Services, and Retail Trade. Note: the SBA calculates the number of people employed by small businesses a 56.1 million, whereas ADP calculates at 97.6 million (1-499 employees) and 49.9 million (1-49 employees).
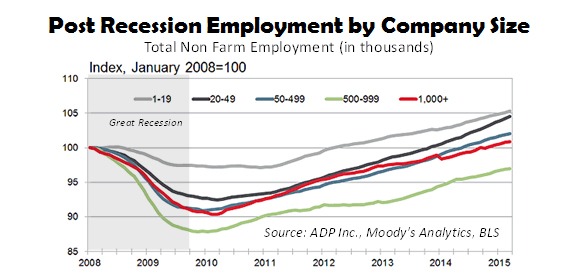
It is a common misconception that small businesses, especially very small (1-19 employees), are the most fragile. The above ADP graphic indicates that very small businesses have been the most resilient of the five business categories following the Great Recession. This fact cannot be understated in an environment where small businesses have been starved for investment capital and meaningful government support.
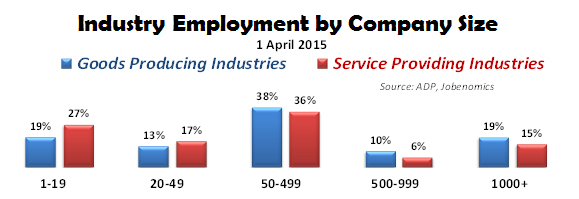
It is also a common misconception that small businesses are only involved service-providing industries whereas large major corporations dominate goods-producing industries. The above chart indicates that small businesses play a major role in both goods-producing (manufacturing, construction, and mining) as well as the service-providing industries.
Thomson Reuters/PayNet Indices provide valuable insight into the health of small business. The Thomson Reuters/PayNet Small Business Lending Index (SBLI)[3] measures the volume of new commercial loans and leases to small businesses. To create the SBLI, PayNet tracks the new borrowing activity by millions of US businesses as reported by the largest lenders. The Thomson Reuters/PayNet Small Business Delinquency Index (SBDI)[4] measures small business financial stress and provides early warning of future insolvency. The most recent SBLI and SBDI are shown.
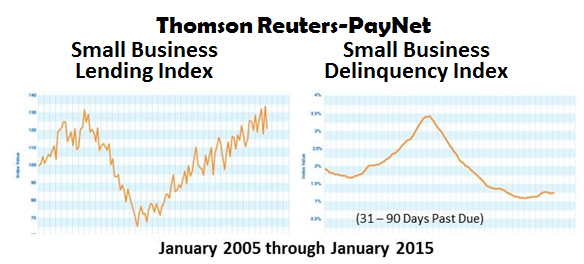
The SBLI (lending) indicates that new loan originations to small businesses have increased slowly since the end of the recession and may now be at the point of significant small business expansion. The SBDI (delinquencies) shows that loan delinquencies (31 to 90 days past due) are close to their lowest points since 2005. This is very good news for future economic growth. Small business creditworthiness is critical to business expansion and jobs creation.
Service-Providing Sector. The US service-providing sector has grown 76% over the last three decades.
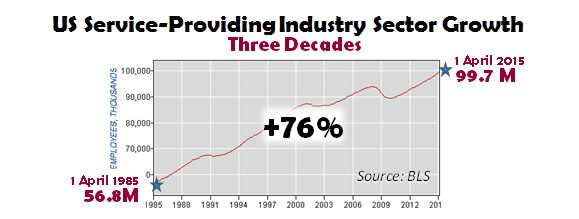
Today, the US service-providing sector employs a total of 99,738,000 people across seven industries. Since year 2010, the US service-providing sector created 10,327,000 new jobs, which equates to 85.5% of all new jobs created by the private sector.
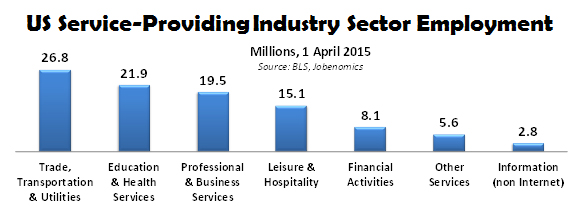
Employment statistics for industries in the service-providing sector are ranked by the number of new jobs created between 1 January 2010 and 1 April 2015 (63 months):
- Professional and Business Services: 3,066,000 new jobs
- Trade, Transportation, Utilities: 2,324,000 new jobs
- Education and Health Services: 2,143,000 new jobs
- Leisure and Hospitality: 2,111,000 new jobs
- Financial Activities: 340,000 new jobs
- Other Services: 305,000 new jobs
- Information (non-internet, like publishing): 38,000 jobs lost
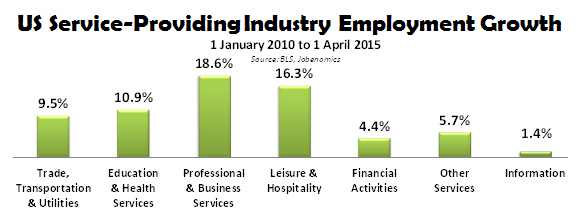
Of the seven service-providing industries, all seven have now gained jobs since the Great Recession ended and the start of the new decade on 1 January 2010. The four three industries are Professional and Business Services (18.6%), Leisure and Hospitality (16.3%), Education and Health Services (10.9%) and Trade, Transportation & Utilities (9.5%).
Goods-Producing Sector. The US goods-producing sector includes Manufacturing, Construction and Mining/Logging industries and has declined 21% since its peak in March 2000.
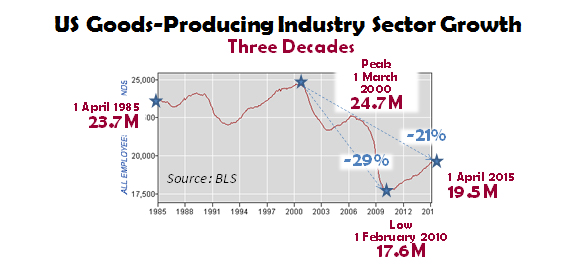
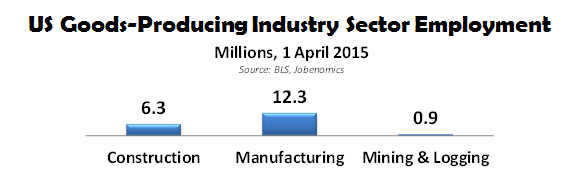
Today, the goods-producing sector employs a total of 19,547,000 people across the three industries: manufacturing, construction and mining/logging. Since year 2010, the US goods-producing sector created 1,755,000 new jobs, which equates to 14.5% of all new jobs created by the private sector.
Employment statistics for industries in this sector are ranked by the number of jobs created between 1 January 2010 and 1 April 2015 (63 months):
- Manufacturing: 844,000 new jobs
- Construction: 690,000 new jobs
- Mining and Logging: 221,000 new jobs
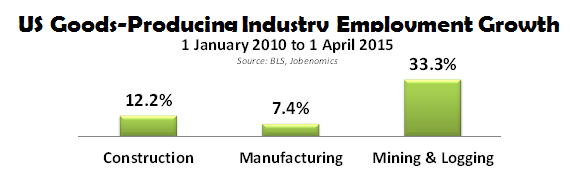
The fastest growing industry in the goods-producing sector is Mining/Logging (33.3%), followed by Construction (12.2%) and Manufacturing (7.4%). The explosive growth in the Mining/Logging industry is largely due to oil and natural gas extraction (via new technologies of fracking and horizonal drilling), and related exploration and support activities.
US Manufacturing Assessment. While manufacturing has added 844,000 new jobs since the beginning of this decade, it has a long way to go to achieve peak its peak level of 19.6 million in June 1979 after sustaining a consistent growth rate from its post-World War II low of 12.5 million in September 1945. Since its peak in 1979, the US manufacturing industry has declined by 37%.
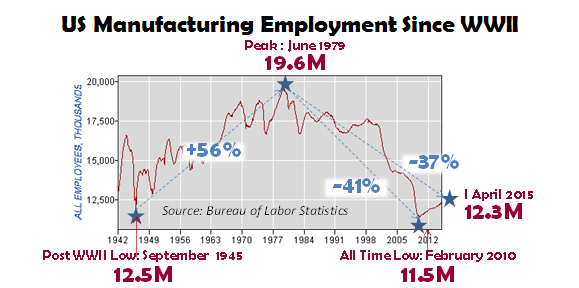
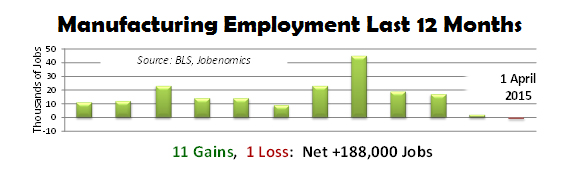
Manufacturing currently employs 12,319,000 people, which is not statistically significant from manufacturing’s all time low of 11,462,000 in January 2010. Manufacturing is still in the doldrums from a historical perspective. Over the last 12 months, manufacturing has had 11 up-months and 1 down-month in terms of employment with a net increase of 188,000 jobs in the last year out of a total of approximately 3.1 million new jobs across all private sector industries.
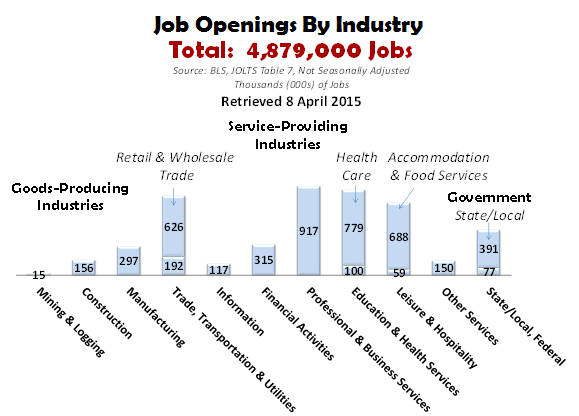
Notwithstanding the political rhetoric about increasing US exports, re-shoring of US manufacturing jobs and increased US productivity, Jobenomics forecasts limited upside jobs potential in manufacturing due to excessive government regulation, improved automation, competitive foreign labor rates, and a lack of high-tech manufacturing skills in our civilian labor force (see Jobenomics’ Manufacturing Industry Forecast posting). The advent of new technologies (like 3D printing of manufactured parts and advanced robotics) reduce the need for non-skilled labor as well as automating many higher level positions in marketing, accounting, machinists and administration. As of the most recent BLS Job Openings and Labor Survey, US manufacturers have 297,000 open high-tech jobs that currently are unfilled out of a total of 4.9 million unfilled jobs across all industries. Jobenomics is also concerned by the amount political and public emphasis on the manufacturing growth as the primary engine for jobs creation. While manufacturing is vitally important to our nation, political emphasis needs to be on the high growth industries in the service sector. Manufacturing emphasis should be on protecting our gains and focusing on next-generation manufacturing technology, processes and recapitalization.
US Construction Industry Assessment. Even though the construction industry is showing signs of growth, the construction sector continues to struggle after a rapid rise (69%) during the go-go years in the 1990s and the housing bubble in the early 2000s.
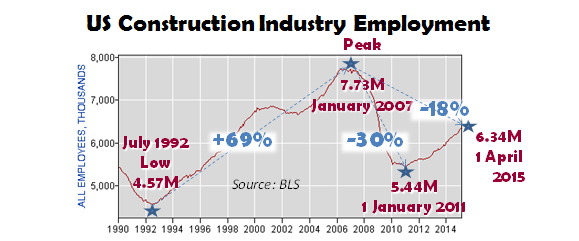
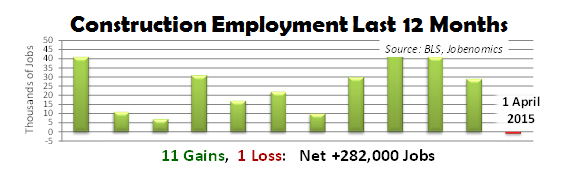
In the 2006-07 time period, peak construction employment was 7.73 million. Today, it is 6.34 million, a loss of 18%. The good news is that construction employment stopped its decline and has increased from its post-recession low of 5.44 million in January 2011. Over the last 12 months, construction has had 11 up-months and only one down-month in terms of employment with a net increase of 282,000 jobs in the last year out of a total of approximately 3.1 million new jobs across all private sector industries.
The US construction industry recovery from the Great Recession is still a work very much in progress.
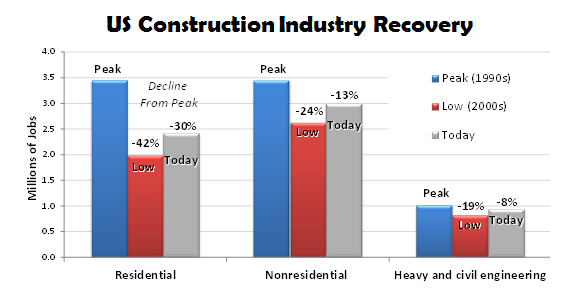
Residential construction employment has been the hardest hit segment with a 42% decrease from its pre-recession peak (3.45 million) to its post-recession low (1.98 million). Today, residential construction employment is still down from its peak by 30% with a total employment of 2.42 million. Nonresidential construction fared slightly better with losses of -24% from peak and -13% today with 2.99 million employed. The heavy and civil engineering sector fared the best (largely due to federal stimulus programs) loosing -19% from peak and now down only -8% with a total of 934,000 employed. As of the most recent BLS Job Openings and Labor Survey, US construction companies have 156,000 open jobs (mainly higher skilled jobs) that currently are unfilled out of a total of 4.9 million unfilled US jobs.
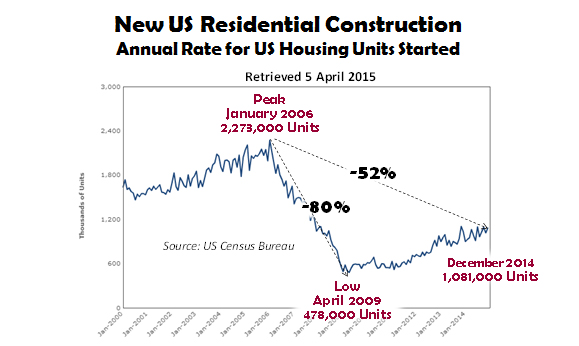
Robust residential construction usually leads economic recoveries. However, this recovery is different. As shown above, according to US Census Bureau Data, new residential starts dropped from a peak 2,273,000 in 2006 to a low 478,000 in April 2009. As of the latest US Census Bureau data available[5], new residential construction starts were 1,081,000 in December 2014, which represents an improvement from a 80% decrease in April 2009 to a 52% decrease today from the January 2006 peak.
The Census Bureau also reports[6] that US home ownership rates have dropped to its lowest level since 1977 and down 5.2% from its high in 2004, 69.2% versus 64.0% respectively. This drop is due to less affordable housing, more restrictive lending, fewer first-time buyers who are renting rather than buying, and people who have dropped out of the housing market.
Jobenomics forecasts that the residential construction industry will not produce a significant number of jobs for the remainder of this decade due to foreclosures, underwater mortgages, unemployment as well as changing attitudes to the value of homeownership. Due to the stagnant economy and government deficits, commercial and heavy construction is also unlikely to produce a significant number of new domestic jobs. Jobenomics does see potential in major foreign construction projects, green construction and renovation of older homes, and reconstruction of disaster areas.
US Mining/Logging Industry Assessment. Mining (oil & gas extraction, coal and minerals) and logging goods-producing sector continues to be a bright area for employment growth. From the beginning of this decade, mining increased employment by 221,000 jobs, with an impressive growth rate of 33.3%. With proper private and public sector support, this industry has significant upside potential.
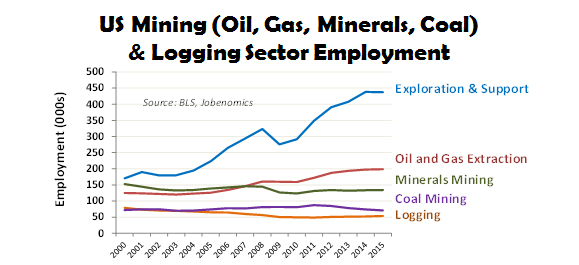
Mining exploration and support employment has more than doubled in the last decade and likely to double again with exploration for domestic energy sources. Oil and gas extraction is also likely to double with new natural gas, oil shale, oil sands and offshore oil resources are exploited via new technology, like horizontal drilling and hydraulic fracturing (fracking). Minerals mining employment has been stagnant over the decade, but this may change as commodity prices (gold, silver, copper) increase as well as worldwide demand for these commodities increase. Coal mining and logging are not likely to increase anytime soon mainly due to environmental pressure and the emphasis on clean renewable technology.
The Government Employment Sector. Total government sector employment currently is 21,898,000. Since 1 January 2010, government has lost 584,000 jobs, a negative 2.6% growth rate. Employment statistics in this sector is shown in the following chart.
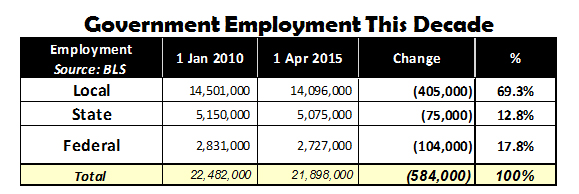
The government sector continued to lose jobs with 69.3% of all job losses occurring with local government (mainly teachers, police and firefighters), 12.8% at the state level, and 17.8% in the federal government (not including military, which is also downsizing). Jobenomics predicts that government job losses will continue to decline due the effects of sequestration as well as debt and deficit spending. In addition, if the US economy suffers an economic disruption due to either domestic or foreign events, government spending will likely decrease further.
In conclusion, business and jobs creation is the number one issue facing US economic recovery. While some would argue that debt/deficits or entitlement/welfare are the biggest issues, it takes businesses to create lasting jobs that generate tax revenue to run government as well as supporting the less fortunate. The following chart is about as simple as Jobenomics can make it.
34% of all Americans financially support the rest of the country. As of the end of Q1 2015, out of a total population of 321 million Americans, 109 million private sector workers support 32 million government workers and government contractors, 17 million unemployed (U6 rate), 93 million able-bodied people who can work but chose not to work, and 69 million who cannot work. Of the 109 million, approximately 67 million individuals work full-time, 27 million are part-timers (less than 35 hours per week) and 15 million are self-employed. The US economy cannot be sustained by 34% supporting an overhead of 66%. More people must be productively engaged in the private sector labor force for the US economy to flourish.
The solution to growing America’s economic base involves engaging our small business engine. Even though severely constrained by limited financing and restrictive government policies, small businesses created 78% of all new jobs in the US since the end of Great Recession.
Jobenomics believes that new small, emerging and self-employed businesses could create 20 million new jobs within a decade, if properly incentivized and supported. Consequently, Jobenomics is focused on four demographics with high growth potential that include Generation Y (via monetizing social networks), Women-Owned Businesses (via direct care business creation), Minority-Owned and Veteran-Owned Businesses. Jobenomics is also working on urban mining of high-value electronic waste and tires to fund Jobenomics Community-Based Business Generators that are designed to mass produce small and self-employed businesses as well as accelerating extant small and medium-sized businesses. If Jobenomics can help create thousands of highly-scalable small businesses, America writ-large can facilitate the creation of millions of small businesses that would transform our economy.
[1] US Bureau of Labor Statistics, Employment Situation Summary, http://www.bls.gov/news.release/empsit.nr0.htm
[2] US Small Business Association (SBA), Office of Advocacy, Frequently Asked Questions, https://www.sba.gov/sites/default/files/FAQ_March_2014_0.pdf & Small Business Profiles Offer Valuable Insight into States’ Economies, February 2015, https://www.sba.gov/sites/default/files/Small_Business_Advocate_Feb_2015.pdf
[3] Thomson Reuters/PayNet Small Business Lending Index, http://paynetonline.com/SmallBusinessInsights/ThomsonReutersPayNetSmallBusinessLendingInde.aspx
[4] Thomson Reuters/PayNet Small Business Delinquency Index, http://paynetonline.com/SmallBusinessInsights/ThomsonReutersPayNetSmallBusinessDelinquency.aspx
[5] US Census Bureau, Business and Industry, Time Series/Trend Charts, New Residential Construction, Annual Rate for Housing Units Started, http://www.census.gov/construction/nrc/historical_data/
[6] US Census Bureau, Table 14. Homeownership Rates for the US and Regions: 1965 to Present, http://www.census.gov/housing/hvs/data/histtabs.html