
Jobenomics Unemployment Report: Q1 2015
http://Jobenomics.com
By: Chuck Vollmer
1 April 2015
Jobenomics tracks both unemployment (Jobenomics Unemployment Scoreboard: Q1 2015) and employment (Jobenomics Employment Scoreboard: Q1 2015). Download PDF versions: Jobenomics Employment Report - Q1 2015 & Jobenomics Unemployment Report - Q1 2015.
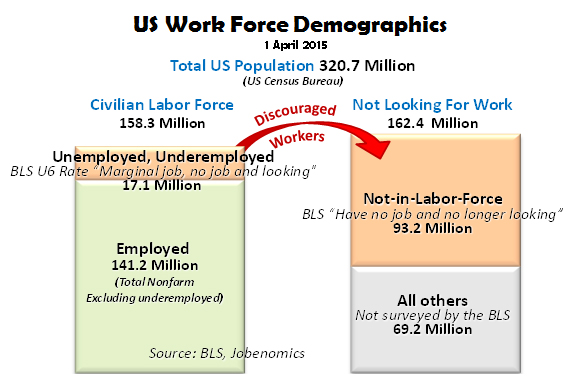
Executive Summary. US labor force has three statistical categories: Employed, Unemployed and Not-in-Labor Force. Understanding dynamics between these categories is needed to understand the current American unemployment situation. Too much attention is placed on the official unemployment rate—a rate that is seriously flawed and politicized. Sooner or later, the American people will figure out that it is theoretically possible for the US to have a zero rate of unemployment while simultaneously having zero people employed in the labor force. From a Jobenomics perspective, the true unemployment rate is much higher than advertised.
Understanding Employment and Unemployment Statistics. According to US Bureau of Labor Statistics (BLS), the basic concepts involved in identifying the employed and unemployed are quite simple:
- People with jobs are Employed.
- People who are jobless, looking for jobs, and available for work are Unemployed. Those who are marginally employed, and looking for jobs, are deemed underemployed. The underemployed are reported as a subset of the Unemployed category.
- People who are neither employed nor unemployed are not in the labor force. Those who have no job and are not looking for a job are counted in the BLS’ Not-in-Labor-Force When a discouraged worker stops looking for work, that person is no longer considered unemployed by the BLS, they are moved into the NiLF category.
Therefore, as shown:
- Civilian Labor Force = Employed + Underemployed + Unemployed = 158.3 million.
- Not Looking for Work = Not-in-Labor-Force + All Others = 162.4 million.
The Civilian Labor Force is defined as citizens, who are either employed or unemployed looking for a job, are at least 16 years old, are not serving in the US armed forces and are not institutionalized.
- The US government and private sector currently employs 141.2 million people. The four major subcategories are: (1) 22 million federal, state and local government employees and an estimated 10 million contractors who work for the government, (2) 67 million full-time private sector employees, (3) 27 million part-time private sector employees (27 million), (4) 15 million self-employed workers.
- There are 17.1 million unemployed people who have a marginal job, no job, and are looking for work.
The Not Looking For Work group includes those Not-in-Labor-Force and All Others in the US population.
- Not-in-Labor-Force includes people (over 16 years old) such as discouraged workers, citizens who choose not to work, welfare recipients, students, retired, stay-at-home caregivers, etc. There are 93.2 million Not-in-Labor-Force people who are considered “marginally attached” to the labor force.
- The remaining citizens not included in the previous three categories are classified generally as All Others by Jobenomics (the BLS does not survey and report on these citizens). Jobenomics calculates that this All Others category includes 69.2 million citizens that cannot work (e.g., children, elderly, disabled), are institutionalized, and are serving in the US armed forces.
Unemployment Rate Categories. Every month, the BLS publishes unemployment and employment statistics for economic, policy and public decision-making. Unfortunately, few policy-makers, opinion-leaders, or American citizens truly understand these statistics. More importantly, Americans tend to focus on only one statistic—the U3 rate or “official” unemployment rate—which is deleterious to good decision making. The chart below highlights the U3 rate against a backdrop of other BLS unemployment (can work and are looking) and Not-in-Labor-Force (can work but are not looking) categories.
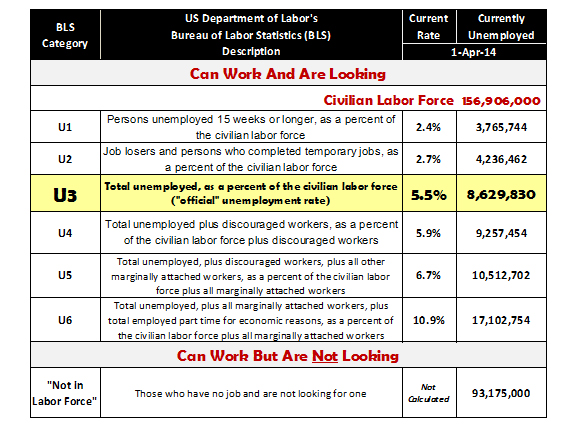
The BLS calculates six unemployment categories (U1 through U6[1]) every month for those that can work and are looking for work. The three most often reported categories are the so called Long-Term U1 Rate, the Official Unemployment U3 Rate, and the Total Unemployment U6 Rate. These rates and numbers are calculated as a percentage of the US Civilian Labor Force, which is less than half of the total US population of 320.6 million[2]. The BLS also calculated those discouraged workers would voluntarily left the work force (some for viable reasons, such as education, and some simply for welfare benefits) to join those in the Not-in-Labor-Force category, which currently stands at 93,175,000—over five times the U6 total unemployed number.
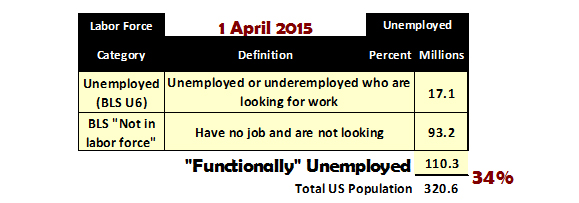
From a Jobenomics perspective, Not-in-Labor-Force citizens should be classified as unemployed. If all underemployed, unemployed and Not-in-Labor-Force people were calculated as unemployed, the total unemployment rate would be an astounding 34% as opposed to the “official unemployment rate” of 5.5%, or 8.6 million versus 110.3 million able-bodied citizens who can work. The determination a person is unemployed should not depend on the subjective, and often whimsical, survey questions if people are looking or not-looking for work. These questions[3] include “(1) Do you currently want a job, either full or part time?, (2) What is the main reason you were not looking for work during the last 4 weeks?, (3) Did you look for work at any time during the last 12 months?, and (4) Last week, could you have started a job if one had been offered?” The bolded words are emphasized when read by the interviewers, according to the BLS.
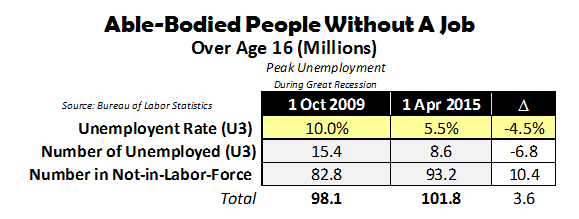
Since the peak of the Great Recession, the official unemployment rate dropped from 10.0% in October 2009 to 5.5% today. Correspondingly, the number of officially unemployed dropped from 15.4 million to 8.6 million, a decrease of 6.8 million people. During the same time period, the number of people who voluntarily dropped out of the work force—many to the netherworld of perpetual unemployment and welfare—increased from 82.8 million to 93.2 million, an increase of 10.4 million. While America reduced its number of it “officially” unemployed, it increased the number of its able-bodied adults without a job by 3.6 million citizens.
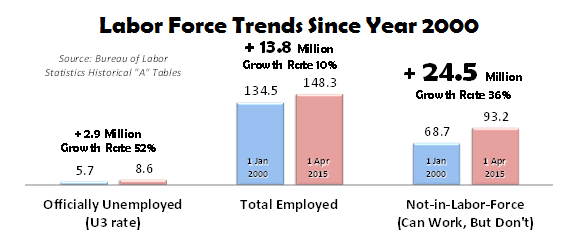
Consequently, the official unemployment rate is a relatively poor indicator of the overall employment situation in the United States. In comparison to those employed and those that can work but don’t (Not-in-Labor-Force), the official unemployment rate is a relatively small number, undeserving of the amount of attention it receives. As shown below, since the beginning of year 2000 to today, the U3 has increased by 2.9 million people compared to employment growth of 13.8 million and Not-in-Labor-Force growth of 24.5 million.
Sooner or later, the American people will figure out that the current way our government calculates unemployment is seriously flawed. Under the current system, it is theoretically possible for the US to have a zero rate of unemployment while simultaneously having zero people employed in the labor force. Stated another way, since Not-in-Labor-Force workers are not counted as unemployed, the official unemployment rate could theoretically be zero if all the current unemployed people simply quit looking for work and joined those in the Not-in-Labor-Force. Americans need to focus on increasing employment and reducing the vast exodus of people leaving our labor force. By shifting focus to business creation, especially small business creation, the number of the unemployed would decrease correspondingly.
The “Not-in-Labor-Force” Category. The downward trends in the US working population and the upward trend in the US non-working population pose serious challenges to America’s economy and way-of-life. These trends are shown in the following charts.
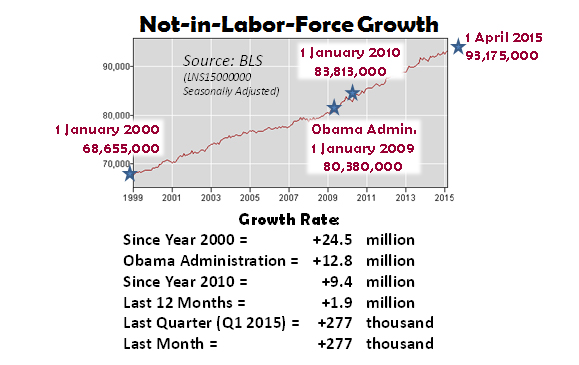
According to BLS data[4], those in the Not-in-Labor-Force category (those that can work but don’t) has surged consistently since year 2000 by 24.5 million people. Since 2009, the start of the Obama Administration, it grew by 12.8 million. Since 2010, the beginning of the decade, it grew by 9.4 million people. In the last 12 months, it grew by 1.9 million. Last quarter and last month, 277 thousand people departed the US labor force and joined the Not-in-Labor-Force category.
A major reason for Not-in-Labor-Force category growth is due to the growing attractiveness of welfare and entitlement benefits. While there is no evidence that people on welfare are lazy or do not wish to work, there is evidence that many welfare recipients lack the skills and attachment to the job market necessary to obtain the types of jobs that pay above-average wages, which makes welfare an attractive option. According to a CATO study[5], the federal government currently funds 126 separate programs targeted toward low-income people. State, county, and municipal governments operate additional welfare programs. Consequently, welfare pays more than minimum wage jobs in 33 states—in many cases, significantly more. For example, according to the CATO study, one would have to make more than $60,000 in Hawaii and more than $50,000 in Washington DC and Massachusetts to beat the level of welfare payments.

According to the latest US Census Bureau data[6], 153,323,310 American received benefits from one or more programs, which equates to 50% of the US population on some form of social or “means-tested” welfare—not including other benefits like the Earned Income Tax Credit (EITC), the Child Tax Credit (CTC), Alternative Minimum Tax (AMT) rebates and Education and Tuition Assistance programs. At the end of Q4 2012, 309.0 million individual payments were made to US welfare receipts out of total US population of 309.5 million Americans. This massive amount of disbursements has created an unemployment-welfare industry characterized by hundreds of thousands[7] of public charities, private foundations and nonprofit organizations dedicated to maximizing welfare and entitlement benefits. These nonprofit organizations yield tremendous social and political power that will continue to fuel the growth of entitlement and means-tested welfare programs as well as growth in the Not-in-Labor-Force category.
A second major reason for Not-in-Labor-Force category growth is due to the growing number of postsecondary school students. According to the US Department of Education[8], total undergraduate enrollment in degree-granting postsecondary institutions was 17.7 million in fall 2012, an increase of 48% from 1990. By 2023, undergraduate enrollment is projected to increase 14% to 20.2 million. Total enrollment in post-baccalaureate degree programs was 2.9 million in 2012, an increase of 57% since 1990. Post-baccalaureate enrollment is projected to increase 24% to 3.6 million by 2023. While Jobenomics endorses post-secondary education, Jobenomics fears that many students attend college for wrong reasons, such as, parental or peer pressure, getting a higher paying job, enjoying the college scene, or delaying the drudgery of the labor force. According The Center for College Affordability and Productivity[9], about half of employed US college graduates are in jobs that the Bureau of Labor Statistics suggests requires less than a four-year college education. Not all degrees are created equal. According to a Georgetown study[10], the risk of unemployment among recent college graduates depends largely on their major. Unemployment/earnings figures for recent health, engineering and arts graduates are 5.4%/$43,000, 7.5%/$55,000 and 11.1%/$30,000 respectively. The Georgetown study cautions students to seriously weigh the benefits verses the costs. In 2013, the average student loan debt was $30,000, but with rising tuitions, $50,000 is a more reasonable figure for future graduates. Many students have a laissez-faire attitude about paying off loans or expecting loan forgiveness. In essence, these students use college loans as a form of social welfare. Unfortunately, the phenomenon of compound interest works on student loans. Unpaid $30,000 loans can compound to double or triple the original amount. For those expecting a federal government loan forgiveness program, they should be more realistic. Outstanding student loans now top $1.2 trillion. Given the $18 trillion national debt, fiscally conservative lawmakers are unlikely to forgive much, regardless of the debt-forgiveness rhetoric of more liberal politicians.
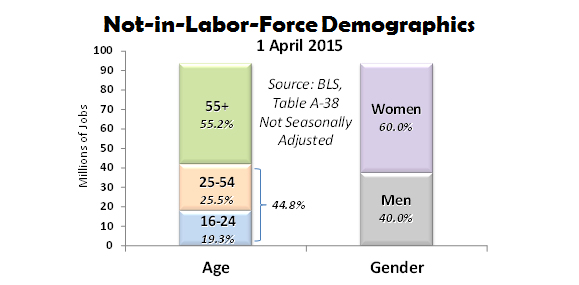
In terms of demographics, the Not-in-Labor-Force includes 52 million people 55 years or older (55.2%), 24 million 25-to-54 year olds (25.5%), and 18 million 16-to-24 year olds (19.3%). In terms of gender, Not-in-Labor-Force includes 56 million women (60.0%) and 38 million men (40.0%). Recent trends have been most unfavorable to those over 55 years old, who once out of work tend to stay permanently out of work.
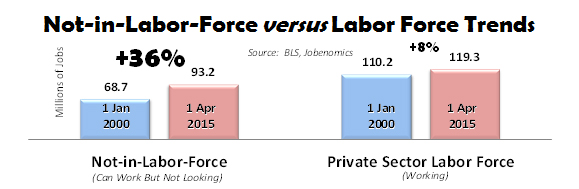
From January 2000 until today, the Not-in-Labor-Force has grown 36% compared to 8% growth in the private sector work force. At the current rate of Not-in-Labor-Force growth, those than can work but choose not to work will outnumber those working sometime in 2023.
Labor Force Participation. Another way to look at the unemployment situation is via the BLS Labor Force Participation Rate and the BLS Employment-Population Ratio.
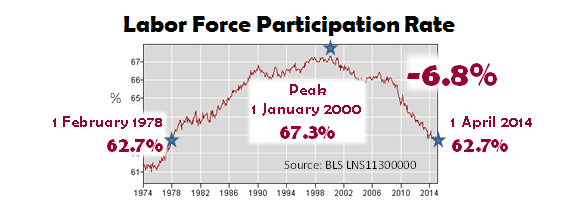
The labor force participation rate is the percentage of working-age persons who are employed or unemployed but looking for a job. Since year 2000, the US working population suffered a serious decline from a high of 67.3% to 62.7% today—a net 6.8% decline from peak and rate that was last seen in February 1978—37 years ago. Today’s labor force participation rate would be much lower if not for working women who did not participate in the US labor force in 1978 as they do today. The primary reason for the dramatic drop in the labor force participation rate is largely due to those that simply have quit looking for work and are now categorized as Not-in-Labor-Force. Alarmingly, the BLS reports that 94% of the people in the Not-in-Labor-Force category currently do not want a job now.
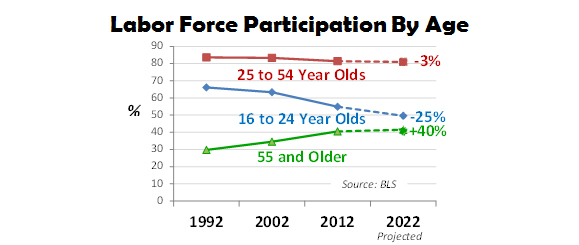
The American workforce is getting grayer. Economic uncertainty is keeping older Americans on the job and delaying retirement. As shown above, the BLS projects that the percentage of older Americans in the US civilian labor force will increase 40% from 1990 to 2020 while the percentage of younger Americans, aged 16 to 24, will shrink by 25%. BLS data also shows that once older workers are out of work, they have a much harder time finding employment than a younger worker.
The BLS’s Employment-Population Ratio[11] is another statistic that is not widely used, but is very useful in a strategic context. This ratio answers the question, “what portion of the working-age population is employed?” and is useful in understanding how our economy is performing. The BLS defines this ratio as the proportion of the civilian noninstitutional population aged 16 years and over that is employed. The civilian noninstitutional population includes the Employed, Unemployed (U6) and Not-in-Labor-Force categories. It does not count the All Others group who cannot work, are institutionalized or serving in the US armed forces.
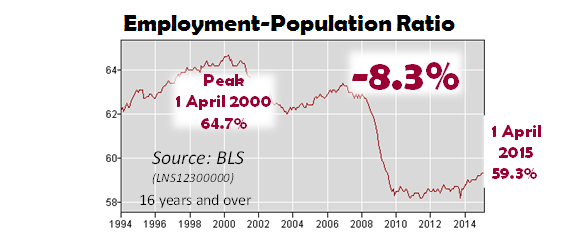
Today, the total US population is 320 million with a civilian noninstitutional population of 250,080,000[12] of which 148,331,000 are employed for an Employment-Population Ratio of 59.3% as shown. From an Employment-Population Ratio perspective, since the peak on 1 April 2000, 8.3% fewer Americans are engaged in the US work force as a percentage of the total working age population. Unless this trend is reversed, America will increasingly be a nation of haves and have-nots due to an eroding middle-class and a growing welfare population.
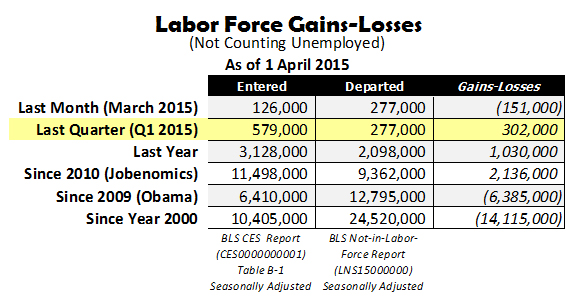
From an unemployment perspective, what really matters is how many people are entering the US labor force as opposed to leaving. According to Bureau of Labor Statistics (BLS)[13] data, last month (March 2015) 151,000 more people departed than entered the US labor force reversing the positive trend earlier in Q1 2015. During Q1 2015 (January, February and March), a total of 579,000 people entered the US labor force and 270,000 voluntarily departed, for a net gain of 302,000—a positive trend that has followed similar employment gains of 2,136,000 jobs since the being of this decade. However, employment gains still have a long way to go. Since the beginning of the Obama Administration, 6,410,000 entered the labor force as compared to 12,795,000 who departed for a net loss of 6,385,000. Since year 2000, 10,405,000 people entered compared to 24,520,000 people who departed—many to a netherworld of perpetual unemployment and welfare—for a net loss of 14,115,000 jobs.
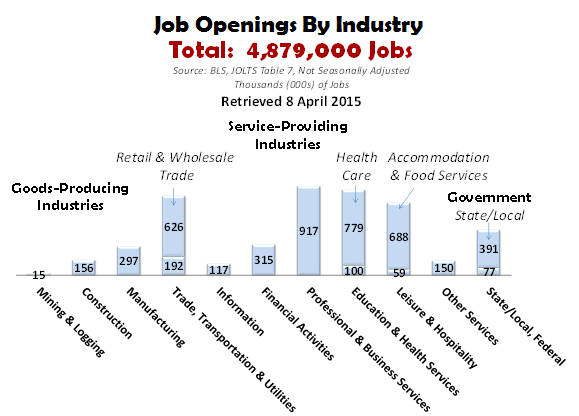
According to the most recent BLS Job Openings and Labor Turnover Survey (JOLTS)[14], there were 4,879,000 job openings. JOLTS includes estimates of the number and rate of job openings, hires, and separations for the nonfarm sector by industry and geographic region. As shown above, the four occupations that had the largest number of openings are: Professional & Business Services (917,000), Healthcare (779,000), Accommodation & Food Services (688,000) and Retail & Wholesale Trade (626,000). State and local government had 391,000 openings. The primary reason for the large number of job openings is due to the lack of job skills. From a Jobenomics perspective this skills gaps is unlikely to be closed in the near-term, which will increase the level of discouraged workers as well as accelerating the flow of people into the Not-in-Labor-Force category.
Small Business Creation Solution. The only true way to reduce unemployment is to create new jobs. Jobs creation involves business creation, especially small business creation. In this decade, US small businesses (less than 500 employees) created 78.0% of all new jobs (note: see Jobenomics Employment Report: Q1 2015). During March 2015, US small businesses created an astounding 90% of all new jobs. Today, small businesses employ 77.8% of all private sector Americans with a total of 92.7 million employees—almost 5 times the amount of large corporations (1000+). Very small businesses with less than 19 employees employ 68% more than all large corporations combined (30.7M versus 18.3M). Contrary to popular opinion, 50% of all small business startups last five years and 30% remain in business over ten years. In addition, small business growth has outperformed medium and large businesses during the recovery from the Great Recession.
Small businesses are important from a long-term unemployed and part-time worker point-of-view, both of whom face employment challenges. Small businesses tend to hire these demographics at a far greater rate than large businesses that are choosy about whom they hire and often give short-shift to those that maybe perceived as employment-challenged. According to ADP data[15], large business (greater than 500 employees) have downsized by 351,000 employees over the last decade, whereas small business (less than 500 employees) have increased employment by 8,051,000. It is a well-established fact that the 500 largest US corporations (Fortune 500) do not hire unemployed personnel regardless of reason.
Jobenomics asserts that the solution to growing America’s economy involves putting our small business engine into over-drive. Energizing existing small businesses and creating new small and self-employed businesses could create millions of new jobs within a decade. To prove the validity of this assertion, Jobenomics is working with a number of US cities to implement Jobenomics Community-Based Business Generators to create thousands of new-start businesses. The objective of a Jobenomics Business Generator is to increase “birth rates” of start-up businesses, extend the “life span” of small businesses, and increase the number of employees per business, which has decreased by approximately 30% since the Great Recession.
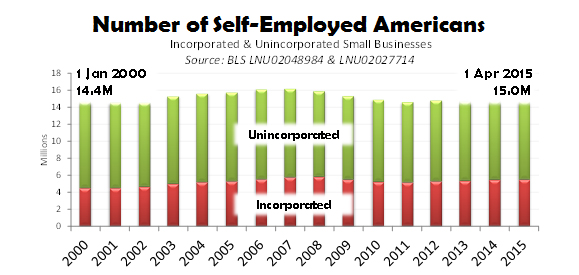
Jobenomics is focused on four demographics with high startup business potential: Generation Y-, Women-, Minority-, and Veteran-Owned Businesses. Approximately 15 million Americans, or 1 out of every 8 people in the private sector labor force, are self-employed in either incorporated or unincorporated businesses. This number has remained relatively stable since the year 2000. With a little encouragement, training and financial support, this number could easily double or triple in the next decade.

The number of US part-time workers has grown 19% since year 2000 to 27,301,000 in April 2015, which is near the all-time high of 28,134,000 in July 2013. Part-time workers are a large component of a much larger group of workers, called contingency workers.
Contingency workers (self-employed and contract workers) currently represent approximately 31% of the US workforce and are projected to increase substantially. According a recent Bloomberg Businessweek article[16], contingency workers could represent 40% of the US labor force in 2020. Given current trends in productivity, technology and necessity, contingent work (part-time workers, consultants, independent contractors, independent professionals, temporary contract workers, seasonal workers, freelancers, etc.) could quickly become the dominant form of labor in the US work force.
Contingent work is called “nonstandard work arrangements” by the federal government, which will be a misnomer if contingent work becomes the dominant form of employment. Government will try to keep this from happening to keep the onus on big business to produce payroll taxes and provide social benefits. In the end, government will fail to keep the US labor force from rationalizing. During the rationalization process, contingency workers will organize in ways that maximizes earnings, benefits and retirement. Jobenomics predicts that micro-businesses will be created to service this need.
Micro-business will likely play a much larger role than ever before. Jobs will increasingly be dissected into discrete tasks, which, in turn, will be addressed by temporary collectives and virtual organizations. Collaborative and management tools will create “contextual” work environments that rapidly form, perform, and then reform to address subsequent tasks. More and more brick and mortar edifices will give way to hoteling and mobile computing. Contingency workers will continue to replace full-time employees.
If Jobenomics can help create thousands of highly-scalable small businesses, America writ-large can facilitate creation of millions of small businesses that would transform our economy. 2015 could be a break-out year for small and self-employed businesses that traditionally have been the primary source of employment for entry-level workers and the long-term unemployed.
In conclusion, business and jobs creation is the number one issue facing US economic recovery. Jobenomics believes that new small, emerging and self-employed businesses could create 20 million new jobs within a decade, if properly incentivized and supported. Consequently, Jobenomics is focused on four demographics with high growth potential that include Generation Y (via monetizing social networks), Women-Owned Businesses (via direct care business creation), Minority-Owned and Veteran-Owned Businesses. Jobenomics is also working on urban mining of high-value electronic waste and tires to fund Jobenomics Community-Based Business Generators that are designed to mass produce small and self-employed businesses as well as accelerating extant small and medium-sized businesses. It takes businesses to create lasting jobs that generate tax revenue to run government as well as supporting the less fortunate.
The following chart is about as simple as Jobenomics can make it.
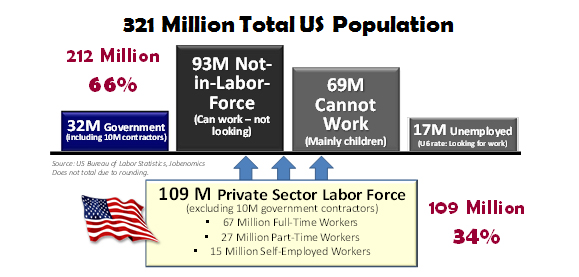
34% of all Americans are financially supporting the rest of the country. As of the end of Q1 2015, out of a total population of 321 million Americans, the US has 109 million private sector workers that support 32 million government workers and contractors, 17 million total unemployed (U6 rate), 93 million able-bodied people who can work but chose not to work, and 69 million who cannot work. Of the 109 million, approximately 67 million works full-time, 27 million works part-time and 15 million are self-employed. The US economy cannot be sustained by 34% supporting an overhead of 66%. More people must be productively engaged in the private sector labor force for the US economy to flourish.
[1] BLS, Table A-15, Alternative measures of labor utilization, http://www.bls.gov/news.release/empsit.t15.htm
[2] US Census Bureau, US & World Population Clocks, http://www.census.gov/main/www/popclock.html
[3] BLS, Who is not in the labor force?, http://www.bls.gov/cps/cps_htgm.htm#nilf
[4] BLS, Table A-16, Persons not in the labor force and multiple jobholders by sex, not seasonally adjusted, http://www.bls.gov/webapps/legacy/cpsatab16.htm
[5] CATO Institute, The Work Versus Welfare Trade-Off:2013, http://object.cato.org/sites/cato.org/files/pubs/pdf/the_work_versus_welfare_trade-off_2013_wp.pdf
[6] US Census Bureau, Economic Characteristics of Households in the United States, Table 2: People by Receipt of Benefits from Selected Programs: Monthly Averages: 4th Quarter 2012 (retrieved 13 April 2015), http://www.census.gov/programs-surveys/sipp/publications/tables/hsehld-char.html
[7] Note: As of 2013, the US has 1,492,186 registered nonprofit organizations. For a complete list see the National Center for Charitable Statistics, http://nccsweb.urban.org/PubApps/profile1.php?state=US
[8] US Department of Education, National Center for Education Statistics, The Condition of Education 2014, Page 58 & 64, http://nces.ed.gov/pubs2014/2014083.pdf
[9] The Center for College Affordability and Productivity, Underemployment of College Graduates, January 2013, http://centerforcollegeaffordability.org/research/studies/underemployment-of-college-graduates/
[10] Georgetown Center on Education and the Workforce, Hard Times: College Majors, Unemployment and Earnings: Not All College Degrees Are Created Equal, http://www9.georgetown.edu/grad/gppi/hpi/cew/pdfs/Unemployment.Final.pdf
[11] BLS, http://data.bls.gov/timeseries/LNS12300000
[12] BLS, Table A-1, Employment Status, http://www.bls.gov/news.release/empsit.t01.htm
[13] US Bureau of Labor Statistics, Employment Situation Summary, http://www.bls.gov/news.release/empsit.nr0.htm
[14] BLS, Job Openings and Labor Turnover Survey (JOLTS), http://www.bls.gov/news.release/jolts.htm
[15] ADP Research Institute, Historical Data, http://www.adpemploymentreport.com/2015/March/NER/NER-March-2015.aspx
[16] Bloomberg Businessweek, 20-25 October 2014 Edition, Companies/Industries, Page 20