
Jobenomics Unemployment Report: June 2014
www.Jobenomics.com
By: Chuck Vollmer
9 June 2014
Jobenomics tracks both employment (see: Jobenomics Employment Scoreboard: June 2014) and unemployment (this posting). Download PDF version: Jobenomics Unemployment Report - 1 June 2014 and Jobenomics Employment Report - 1 June 2014
Executive Summary. According to the June 2014 Bureau of Labor Statistics (BLS) Employment Situation Summary[1], the unemployment rate remained unchanged at 6.3%, total nonfarm payroll employment rose by 217,000 (which is less than the commonly used 250,000 benchmark), and the “not in labor force” category decreased by 9,000 citizens who quit looking for work. Overall, this is a positive report, but not yet indicative of a sustained economic recovery.
As reported by Jobenomics for the last three years, the official unemployment rate is a misleading statistic. It is theoretically possible for the US to have a zero rate of unemployment while simultaneously having zero people employed in the labor force. To be counted in the “Officially Unemployed (U3)” category, people have to be looking for work. When a person stops looking, the BLS moves them into the “Not-in-Labor-Force” category that is reserved for those who can work but are no longer looking.
Since year 2000, over 3 times as many people departed the US labor force than entered it, with 7,685,000 entering as opposed to 23,354,000 departing. These numbers indicate that while improving slightly, the US economy is not sustainable due to massive exodus of people from the labor force resulting in 30-year low labor participation rates and employment-to-population ratios.
Today, out of a total population of 318 million Americans, the US has 108 million working in the private sector, 32 million government workers, 19 million unemployed, 92 million able-bodied people who can work but are not looking, and 69 million (mainly children, retired and disabled) who cannot work. The US economy cannot be sustained by 34% supporting an overhead of 66%. More people must be productively engaged in the private sector labor force for the US economy to flourish. The solution to growing the tax-base involves business creation.
Jobenomics advocates small, emerging and self-employed business growth. Today, small businesses employ 77.4% of all private sector Americans with a total of 90.0 million employees—almost 5 times the amount of large corporations (1000+). Very small businesses with less than 19 employees employ 65% more than all large corporations combined (30.4M versus 18.4M). This decade, small businesses created 71% of all net new jobs. Last month, May 2014, small businesses created 80% of all new jobs. Contrary to popular opinion, 50% of all small business startups last five years and 30% last over ten years.
Understanding Employment and Unemployment Statistics. According to US Department of Labor, the basic concepts involved in identifying the employed and unemployed are quite simple:
- People with jobs are Employed.
- People who are jobless, looking for jobs, and available for work are Unemployed. Those who are marginally employed, and looking for jobs, are deemed Underemployed.
- People who are neither employed nor unemployed are not in the labor force. Those who have no job and are not looking for a job are counted in the BLS’ Not-in-Labor-Force (NiLF) category. When a discouraged worker stops looking for work, that person is no longer considered unemployed by the BLS, they are moved into the NiLF category.
Therefore, as shown:
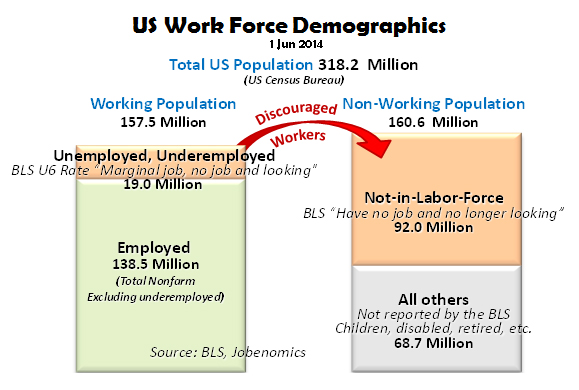
- Working Population = Employed + Underemployed + Unemployed = 157.5 million.
- Non-Working Population = Not-in-Labor-Force + All Others = 160.6 million.
The Working Population includes 138.5 million employed and 19.0 million people who have a marginal job, no job, or are looking for work (U6 category). The BLS calls this group, the “Civilian Labor Force”, which is defined as citizens, who have jobs or are seeking a job, are at least 16 years old, are not serving in the military and are not institutionalized.
The Non-Working Population includes 92.0 million in the BLS’ Not-in-Labor-Force category who can work but are not looking. Not-in-Labor-Force includes people (over 16 years old) such as discouraged workers, citizens who choose not to work, welfare recipients, students, retired, stay-at-home caregivers, etc. The remaining All Others category that include 68.7 million children, elderly, disabled, serving in the military, incarcerated, etc.
Unemployment Rate Categories. Every month, the BLS publishes unemployment and employment statistics for economic, policy and public decision-making. Unfortunately, few policy-makers, opinion-leaders, or American citizens truly understand these statistics. More importantly, Americans tend to focus on only one statistic—the U3 rate or “official” unemployment rate—which is deleterious to good decision making. The chart below highlights the U3 rate against a backdrop of other BLS unemployment (can work and are looking) and not-in-labor-force (can work but are not looking) categories.
The BLS calculates six unemployment categories (U1 through U6[2]) every month for those that can work and are looking for work. The three most often reported categories are the so called Long-Term U1 Rate, the Official Unemployment U3 Rate, and the Total Unemployment U6 Rate. These rates and numbers are calculated as a percentage of the US Civilian Labor Force, which is less than half of the total US population of 318 million[3].
As of 1 June 2014, the U1 category is currently 3.1% with 4.8 million unemployed longer than 15 weeks. The U3 category is 6.3% with 9.8 million “officially” unemployed. The U6 category is 12.2% with 19.0 million under-employed or unemployed citizens.
The official unemployment rate (U3 Rate) is a relatively poor indicator of the overall employment situation in the United States. In comparison to those employed and those that can work but don’t (Not-in-Labor-Force), the official unemployment rate, called the U3 rate, is a relatively small number, undeserving of the amount of attention it receives. As shown above, since the beginning of year 2000 to today, the U3 has increased by 4.1 million people compared to employment growth of 11.3 million and Not-in-Labor-Force growth of 23.4 million.
Sooner or later, the American people will figure out that the current way our government calculates unemployment is seriously flawed. Under the current system, it is theoretically possible for the US to have a zero rate of unemployment while simultaneously having zero people employed in the labor force. Stated another way, since Not-in-Labor-Force workers are not counted as unemployed, the official unemployment rate could theoretically be zero if all the current unemployed people simply quit looking for work and joined those in the Not-in-Labor-Force.
Jobenomics contends that Americans need to focus on increasing employment with emphasis on small businesses that currently employ 77% of the US work force, and reducing the vast exodus of people leaving our labor force—many to a netherworld of perpetual unemployment and welfare. By shifting our focus to business creation, especially small businesses the mainstay of the US economy, the number of the unemployed would decrease correspondingly.
The chart above shows the recent US employment history[4]. US peak employment occurred in January 2008 with 138.1 million employed. The post-Great Recession low occurred in February 2010 with 129.3 million employed. Today, there are 138.4 million employed in government and the private sector. Consequently, 8.7 million jobs were lost from peak to low. From the low to present, 8.8 million jobs were created. From the start of the Obama Administration, the US produced 3.7 million net new jobs. From the start of this decade, the Jobenomics starting point, 8.8 million jobs were created—all in the private sector, whereas each level of government (federal, state and local) lost jobs. The good news is that the USA has recently recovered all the jobs lost during the Great Recession.
Labor Force Participation. Another way to look at our employment/economic situation is via the Labor Force Participation Rate[5].
The labor force participation rate is the percentage of working-age persons who are employed or unemployed but looking for a job. Since year 2000, the US working population suffered a serious decline from a high of 67.3% to 62.8% today—a 6.7% decline from peak and rate that was last seen in January 1978. Today’s labor force participation rate would be much lower if not for working women who did not participate in the US labor force in 1978 as they do today.
The primary reason for the dramatic drop in the labor force participation rate is largely due to those that simply have quit looking for work and are now categorized as Not-in-Labor-Force. Alarmingly, the BLS reports that 93% of the people in the Not-in-Labor-Force category currently do not want a job now.
The American workforce is getting grayer. Economic uncertainty is keeping older Americans on the job and delaying retirement. As shown above, the BLS projects that the percentage of older Americans in the US civilian labor force will increase 40% from 1990 to 2020 while the percentage of younger Americans, aged 16 to 24, will shrink by 25%. BLS data also shows that once older workers are out of work, they have a much harder time finding employment than a younger worker.
The BLS’s Employment-Population Ratio[6] is another statistic that is not widely used, but is very useful in a strategic context. This ratio answers the question, “what portion of the working-age population is employed?” and is useful in understanding how our economy is performing. Since 1 Apr 2000, 8.9% fewer Americans are engaged in the US work force. Unless this trend is reversed, America will increasingly be a nation of haves and have-nots due to an eroding middle-class.
The “Not-in-Labor-Force” Category. The downward trends in the US working population and the upward trend in the US non-working population pose serious challenges to America’s economy and way-of-life. These trends are shown in the following charts.
From January 2000 until today, the Not-in-Labor-Force has grown 34% compared to 6% growth in the private sector work force. At the current rate of Not-in-Labor-Force growth, those than can work but choose not to work will outnumber those working sometime in 2023.
According to BLS data[7], those in the Not-in-Labor-Force category (those that can work but don’t) has surged consistently since year 2000 by 23.4 million people. Since 2009, the start of the Obama Administration, it grew by 11.6 million. Since 2010, the beginning of the decade, it grew by 8.2 million people. In the last 12 months, it grew by 2.3 million. Last month, the trend reversed itself with 9 thousand less people voluntarily leaving the US work force.
In terms of demographics, the Not-in-Labor-Force includes 50 million people 55 years or older (54.9%), 24 million 25 to 54 year olds (25.9%), and 18 million 16 to 24 year olds (19.2%). In terms of gender, NiLF includes 55 million women (59.8%) and 37 million men (40.2%). Recent trends have been most unfavorable to those over 55 years old, who once out of work tend to stay permanently out of work.
The “Functionally Unemployed”. Jobenomics defines “functionally unemployed” as the total number of people that have no job and are capable of working—111.0 million Americans. From a Jobenomics perspective, Not-in-Labor-Force citizens should be classified as long-term unemployed. If all underemployed, unemployed and Not-in-Labor-Force people were “functionally unemployed”; the unemployment rate would be an astounding 35%.
The Jobenomics “functionally unemployed rate” is 35% or 111.0 million people. 111.0 million is calculated by adding the BLS’ U6 number (19.0 million) and the BLS’ Not-in-Labor-Force number (92.0 million, the BLS’s seasonally adjusted number). Dividing 111.0 million by the total US population of 318.2 million yields a functionally unemployed rate of 35%. Understanding the functionally unemployed rate of 35% is a much better indicator of economic distress, than the much lower 6.3% “official” U3 unemployment rate that is most often watched and reported.
In conclusion, business and jobs creation is the number one issue facing US economic recovery. While some would argue that debt/deficits or entitlement/welfare are the biggest issues, it takes businesses to create lasting jobs that generate tax revenue to run government as well as supporting the less fortunate. The following chart is about as simple as Jobenomics can make it.
34% of all Americans are financially supporting the rest of the country. 108 million workers in the private sector are supporting 32M that work for government (including contractors), 92M that can work but choose not to work, 69M that cannot work (children, retired, disabled, etc.) and 19M that are looking for work (officially unemployed and unemployed). For the American economy to prosper in the 21st Century, we must place more emphasis in growing the private sector labor force and reducing the overhead with emphasis on stemming the exodus of people looking for work to not looking for work.
The solution to growing America’s economic base involves engaging our small business economic engine, which is discussed in detail in the Jobenomics Employment Report: June 2014. Even though severely constrained by limited
financing and restrictive government policies, small businesses created 71.2%
of all new jobs in the US since the end of Great Recession as well as a record
79.5% last month. Jobenomics believes that new small, emerging and self-employed businesses could create 20 million new jobs within a decade, if properly incentivized and supported.
[1] US Bureau of Labor Statistics, Employment Situation Summary, http://www.bls.gov/news.release/empsit.nr0.htm
[2] BLS, Table A-15. Alternative measures of labor utilization, http://www.bls.gov/news.release/empsit.t15.htm
[3] US Census Bureau, US & World Population Clocks, , http://www.census.gov/main/www/popclock.html
[4] BLS, Table B-1, Total Nonfarm, Seasonally Adjusted, http://data.bls.gov/timeseries/LNS12300000,
[5] BLS, Labor Force Participation Rate, http://data.bls.gov/timeseries/LNS11300000
[6] BLS, http://data.bls.gov/timeseries/LNS12300000
[7] BLS, Table A-16, Persons not in the labor force and multiple jobholders by sex, not seasonally adjusted, http://www.bls.gov/webapps/legacy/cpsatab16.htm