
Download PDF Version: Long-Term Deficit Reduction 23 Jan 2013
23 January 2013
Jobenomics predicts that 2013 will be a pivotal year for the US economy. For 2013, Jobenomics assesses the following probabilities: 20% chance that the economy will improve, 20% that it will continue to muddle along, and 60% it will get worse, or perhaps much worse, depending on financial disruptions. The biggest near-term financial disruption involves a long-term deficit reduction agreement between the White House, the Democrat-controlled Senate and the Republican-controlled Congress.
To better understand long-term deficit reduction issues, Jobenomics created the following charts from data taken from current and historical White House fiscal documents[1].
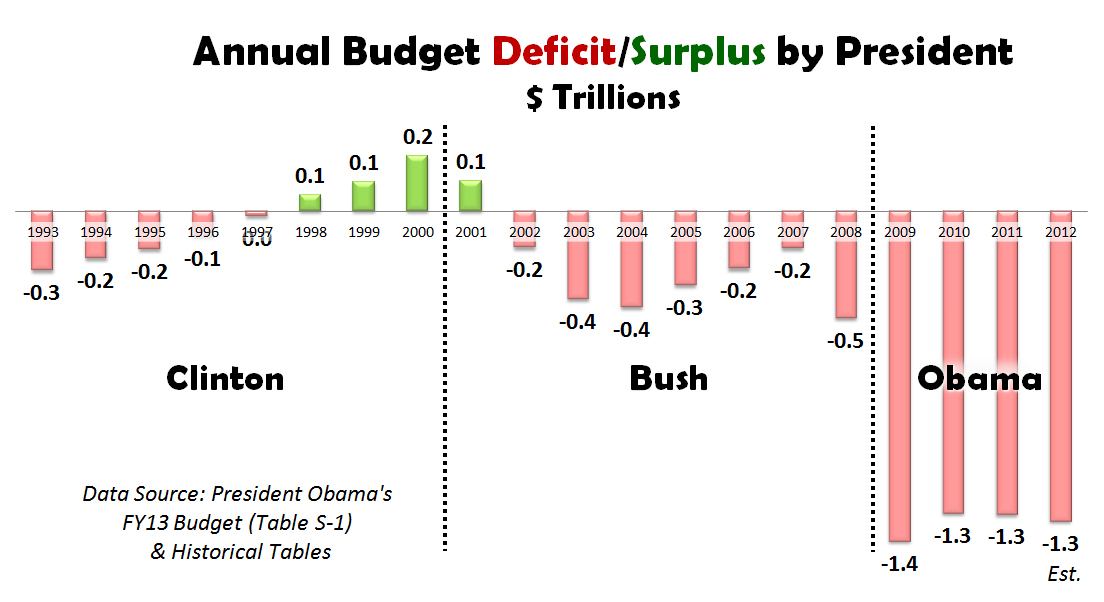
According to White House budget data, over the last twenty years there have been only four years where the US federal government spent less than they received in tax revenues (surplus). As shown above, the Clinton Administration spent a net $300 billion more (deficit) than it received during the eight years the president was in office. The Bush Administration spent $2.0 trillion more than it received in eight years in office. The Obama Administration spent $5.3 trillion more than it received in four years in office. The reasons for these budget deficits are numerous and complex. However, it is safe to say that President Clinton had the benefit of the information technology revolution that created tens of millions of new jobs, and no major financial crises. Presidents Bush and Obama were not so fortunate.
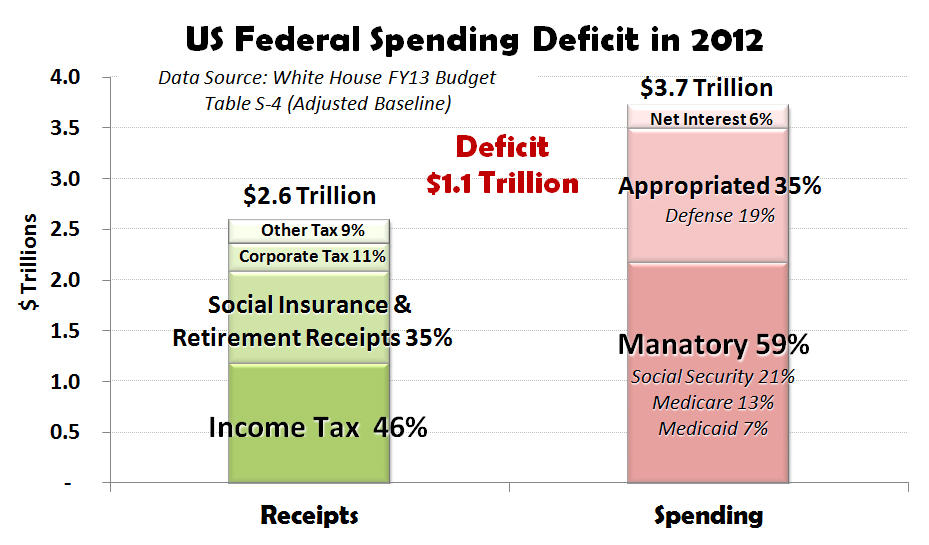
While the latest figures for 2012 are still being tallied, the US federal deficit last year was $1.1 trillion with receipts of $2.6 trillion versus spending of $3.7 trillion. Individual income taxes and social insurance & retirement receipts (FICA taxes) accounted for 81% of the federal government’s income. On the spending side, mandatory spending for entitlements (mainly Social Security, Medicare and Medicaid) represented 59%. Mandatory spending are those expenditures that are mandated by Federal law that can’t be changed without an act of Congress. Appropriated spending (35%) represents the money set aside each year for running the government and the US armed forces. Net interest (6%) is the amount of interest paid on the money that the federal government has borrowed.
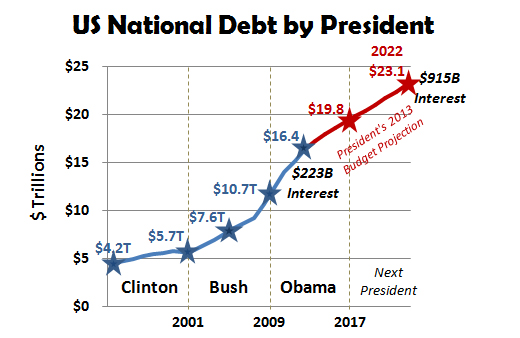
To finance the receipts/spending gap, the US federal government has been increasing the money supply (printing more money) and borrowing via the sale of US treasury bonds. As a result, our national debt has been rising rapidly. When President Bush took office, the national debt was $5.7 trillion. When he left office it was $10.7, which equated to approximately $625 billion per year for his eight years in office. When President Obama took office, the national debt was $10.7 trillion. Today it is $16.4, which equates to approximately $1.425 billion per year for his first four years in office. In 2012, the interest paid on the national debt was $223 billion. By 2022, interest payments will be $915 billion per year and the national debt $23.1 trillion according President Obama’s FY13 Budget projections.
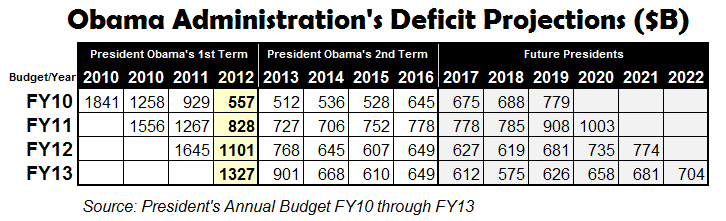
The Obama Administration’s deficit spending projections have not been very accurate. As shown, the Obama Administration has consistently spent $200-$300 billion more each year than forecast. For example, the President’s FY10 Budget forecast a deficit of $557 billion in 2012, but raised the forecast each consecutive year, reaching $1327 billion in the President’s FY13 Budget—an increase of $770 billion in three years. Consequently, it reasonable to believe that trillion dollar deficits may be likely for the next few years, especially considering the needs of the financially distressed in America’s current silent depression.
Having roots as a community activitist, President Obama is acutely aware of the needs of Americans trapped in today’s silent depression. Most Americans associate depressions with people standing silently in long bread and soup lines. Today, we have 47 million Americans with food stamps standing mute in grocery store lines. Those standing idly by extend beyond grocery stores. According to the Bureau of Labor Statistics, in addition to the 22 million who are unemployed or underemployed, 88 million idle citizens that can work no longer look for work. Another 59 million receive some form of Medicaid. 51 million receive Social Security payments. 46 million fall below the poverty level and receive supplemental income from the government. 45 million are Medicare beneficiaries. And the list goes on. The total population of the US is 315 million. Last year, approximately 350 million welfare or entitlement payments were made. In this environment, meaningful spending cuts may be politically impossible due to the pervasive needs of over 100 million financially distressed Americans. It took the sacrifices of WWII and America’s unified response to restore prosperity. Let’s pray that it will not take another world war to help solve our long-term deficit reduction problem.
Long-term deficit reduction is essential for economic recovery, but for the last four years the budget process has not worked as it was designed to do. Normally, the president submits his annual budget to Congress in February. Then the Senate and House settle on a resolution for the 13 appropriation bills in October. However, the Senate and House have not been able to reach agreement on spending and taxes since 2009. In absence of such an agreement, the federal government has been operating on a series of stopgap funding bills, continuing resolutions, omnibus packages and last-minute deals to avoid government shutdowns and defaults. Over the last month alone, the fiscal-cliff and deficit-ceiling crises were sidestepped by kicking the can down the fiscal road until the March/April timeframe.
It is essential that President Obama presents his FY14 Budget to Congress in February with a balanced approach to reducing deficit spending. It is also essential that Senate Democrats develop a framework with the House Republicans on ways to shrink trillion-dollar annual deficits. Without a balanced approach and common cause, the US economy is likely to slide back into recession. Short-term deficit reduction gimmicks, such as continuing resolutions, have likely reached the end of their road. America needs to balance its books.
In December 2012, the federal government reached the current debt limit ($16.4 trillion) and hence it’s borrowing capacity. The debt ceiling is the statutory limit on the amount money that the US government is authorized to borrow to meet financial obligations. According to the Constitution, Congress has sole authority to raise the debt ceiling. The debt ceiling would have to be raised approximately $1 trillion in order to extend the Administration’s ability to borrow through 2013. It is unlikely that the Republican-controlled House will authorize this level of borrowing without meaningful spending cuts.
Failing to increase the debt limit would cause the government to default on its legal obligations that could precipitate an acute financial crisis. If additional borrowing is not authorized by Congress, the Administration will not be able to pay its bills (default). If the federal government is unable to borrow, it would be forced to default on some of its financial commitments, limiting or delaying payments to; creditors (such as interest payments that are mostly owed to foreign governments like China, Japan and Arab countries), beneficiaries (military salaries, Social Security and Medicare payments and unemployment benefits), and government contractors and vendors. Financial markets would also be affected including; downgraded US credit ratings, volatility in stock and bond markets, upward pressure on interest rates, reduced business investment, higher unemployment, recession, and increased calls by the international community to seek an alternative to the US dollar as the world’s reserve currency.
Jobenomics believes that moderate tax increases and spending cuts are both needed to balance our books, but the real solution involves growth. Private sector business is the engine that creates enduring growth. Moreover, it is small, emerging and self-employed businesses that have created 65% of all new jobs since the end of the Great Recession. This remarkable small business achievement was accomplished with little support of the federal government, financial institutions or big business. Small business benefits little from political rhetoric on education, training, hiring incentives and reduced regulation. What small business needs is financing and community-based business generators that mass-produce, finance and sustain new businesses at the base of America’s economic pyramid.
Jobenomics is working with numerous private and public (mostly mayors) institutions to establish community-based business generators that focus on four demographics: inner city groups (service-providing businesses that focus on journeyman skill sets), women-owned businesses (direct-care, direct-sales and education/training businesses), Generation Y (start-up businesses that focus on monetizing social networks) and veterans-owned businesses (businesses that specialize in defense industry related occupations). These demographics have the potential for 10s of millions of jobs and millions of new businesses. These new businesses will not only create economic growth but will provide hope to the unemployed, underemployed and discouraged individuals who can work but are no longer looking. Long-term deficit reduction issues can only be solved by long-term growth and initiatives to provide income opportunity for all our citizens.
[1] The White House, President Barak Obama, Office of Management and Budget, The Budget, Fiscal Year 2013 and Historical Tables, 21 Jan 2013, http://www.whitehouse.gov/omb/budget/Overview