
Download PDF Version: Debt Limit Catastrophe 11 Oct 13
11 October 2013
Executive Summary. This posting addresses a potential national debt limit default that is a growing concern amongst politicians, economists, pundits and opinion-leaders—many of whom are predicting catastrophic scenarios. While catastrophic scenarios are possible, Jobenomics forecasts that a default is unlikely. However, Jobenomics predicts that the ideological divide between America’s political left and right will continue to worsen leading to an era of chronic uncertainty where threats of government shutdowns and defaults will reoccur on a regular basis.
National Debt. National debt is government or public debt as opposed to private debt (mortgages, credit cards, etc.) and corporate debt. National debt is debt owed by the US federal government via the sale of Treasury securities that are tradable financial instruments secured by the US government.
The practice of issuing and selling Treasury securities started in WWI when the US could not borrow from the larger wealthier nations that were also embroiled in war. In order to meet wartime expenses, the US government decided to issue war bonds, which were called Liberty Bonds. These bonds carried a reasonable interest rate and were backed by the full faith and economic power of the US government. Liberty Bonds sold quickly and the US government met its financial obligations. After WWI, when the Liberty Bonds reached maturity, the US government did not have enough surplus funds to pay the bonds, so it issued more bonds at an attractive rate. The Treasury also issued several different types of bonds with varying maturity rates. These bonds also sold quickly and were often traded on the open market at a higher price. In 1929, the US Treasury adopted an auction process that let people and institutions bid on bonds. The highest bidder was awarded the bond. This process is still used today.
As shown above, US Treasury bills, notes and bonds are the dominant components of national debt that has reached $16.738 trillion as of 30 September 2013. Treasury Bills (T-Bills) mature in 1 year or less. Treasury Notes (T-Notes) mature in 1 to 10 years. Treasury Bonds (T-Bonds or long bonds) mature in 20 to 30 years. Treasury Inflation-Protected Securities (TIPS) are inflation-indexed bonds. Other types of Treasury securities include; Foreign and domestic series certificates of indebtedness, notes and bonds, Savings bonds; Government Account Series (Social Security); State and Local Government series and special purpose securities.
National debt can be categorized in three ways:
- Debt held by the public versus intragovernmental holdings. Debt held by the public includes all debt held outside the government including debt held by individuals, corporations, pension funds, investment groups, the US Federal Reserve System, US states, US municipalities and foreign governments. Intragovernmental holdings consist mainly of federal trust funds, such as Social Security, Medicare, Transportation, and Civil Service Retirement accounts. $11.976 trillion or 72% of the US national debt is held by the public and $4.762 trillion or 28% by the US government.
- Marketable versus nonmarketable. Marketable means that these securities can be traded on the open market like stocks. $11.596 trillion or 69% of the US national debt is marketable.
- Internal debt versus foreign debt. Internal debt is owed to lenders within the United States, and external debt is owed to foreign lenders (mainly foreign governments). Foreign governments own $5.59T of US government Treasuries, or 48% of marketable securities, which provides foreigners tremendous financial leverage over the US.
According to US Treasury data[1], China holds $1.277 trillion (23%) of US Treasury external debt, followed by Japan with $1.135 trillion (20%). The next largest entity is Caribbean Banking Centers (Bahamas, Bermuda, British Virgin Islands, Cayman Islands, Netherlands Antilles, Panama) with $0.288 trillion (5%) followed by Oil Exporters (Ecuador, Venezuela, Indonesia, Bahrain, Iran, Iraq, Kuwait, Oman, Qatar, Saudi Arabia, UAE, Algeria, Gabon, Libya, Nigeria) with $0,258 trillion (4.6%). Brazil, Taiwan, Switzerland, Belgium, UK, Luxembourg and Russia hold between $0.256 trillion to $0.132 trillion each. All other countries hold a total of $1.409 trillion combined.
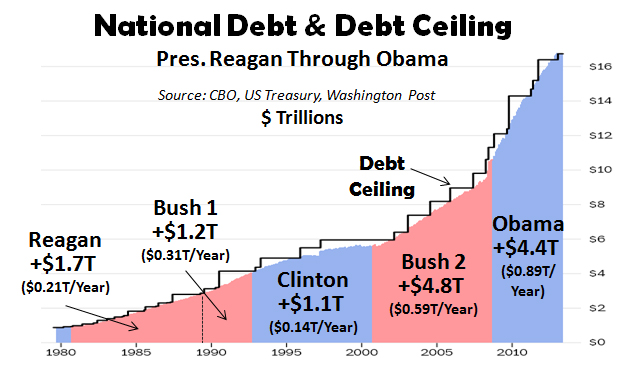
Over the last five years, the US federal government spent approximately $1 trillion per year more than it received in tax income revenue leading to an ever increasing national debt as shown above. A significant portion of this overage is due to interest payments. According to the President’s 2014 Budget Request[2], the interest on the national debt in 2013 was $220 billion a year and is projected to quadruple to $804 billion within a decade. $220 billion is approximately equal to the combined total of Agriculture ($23B), Commerce ($8B) Education ($70B), Energy ($27B), EPA ($8B), Homeland Security ($40B), NASA ($18B) and Housing and Urban Development ($34B), and is about 42% of the 2013 Defense budget ($525B), according to the President’s 2014 Budget. The US Treasury reports[3] a much higher number ($415 billion) for interest expense in Fiscal Year 2013.
National Debt Ceiling or Limit. The debt ceiling is the total amount of money the US government can borrow (by selling Treasuries) to pay its obligations, including interest on the national debt, entitlements and discretionary spending (defense, education, energy, veterans, agriculture, etc.). The first debt ceiling was created by Congress to put an upper limit on federal borrowing during WWI. The debt ceiling has been extended (raised) approximately 90 times from 1917 to 2001. Since 2001, it has been extended 14 times.
The 1995 debt ceiling crisis led to debate regarding the size of the federal government, which lead to the non-passage of the federal budget, and the federal government shutdown.
The 2011 debt ceiling crisis led to the first ever downgrade in the federal government’s credit rating and a massive drop in the stock market.
As of 30 September 2013, the US Treasury reported that the US breached its national debt ceiling limit of $16.7 trillion and would run out of cash reserves by 17 October 2013. Consequently, a 2013 debt ceiling crisis is now underway with a stalemate between Democrat-lead Whitehouse and Senate versus Republican-lead House of Representatives.
Jobenomics Forecast. Jobenomics predicts that the America political divide will continue to widen in the foreseeable future unless a major fiscal or physical disruption creates common cause. Unless the political extremes find common ground, economic brinksmanship will likely continue in the House of Representatives—the holders of the purse—until the economy changes or the Democrat minority gains majority in 2014 or 2016. The Democrat-lead Whitehouse and Senate are wedded to securing social programs for the growing number of financially distressed individuals and families. The Republican-lead House of Representatives are equally committed to fiscal constraints that will secure future Americans from the ravages of a financial meltdown. From a Jobenomics perspective, both are needed, but the dialogue needs to change from entitlements versus austerity to a monologue of growth (with emphasis on growth of small business that employs 77% of all Americans).
In the near-term, Jobenomics predicts that the Administration and Congress will avoid defaulting on debt payments. However, the brinksmanship could continue until after the 17 October 2013 deadline with significant (but not necessarily catastrophic) consequences.
As of this posting a week before the 17 October deadline, both sides are moving towards an agreement to extend the nation’s borrowing limit for short period of time and creating a framework for broader deficit-reduction talks. However, a short period of time to Congressional Republicans means weeks as opposed to months or a year for the Democrats. Consequently, the brinksmanship is likely to continue until late October or early November.
If the 17 October deadline is breached, borrowing authority of the US would be exhausted but the US federal government would use tax revenues to pay for essential services and obligations. Total federal tax revenue[4] in FY13 was $2.712 trillion, or $226 billion per month, that could be used to avoid defaulting on priority expenditures. Total outlays for FY13 were $3.685 trillion, or $307 billion per month, which could create an $81 billion shortfall per month ($307B-$226B) based on current spending habits. In other words, the US government would have only enough revenue to pay for ¾ of current services and obligations but would not have the ability to borrow for the remaining ¼.
While it is highly unlikely that the US government will default, significant damage would be caused to the US economy if the brinksmanship lasted more than a few days after the 17 October deadline. In the aftermath of the 2011 debt ceiling crisis, the US government’s bond rating was reduced by one of the three major credit-rating agencies (Standard & Poor’s) for the first time in America history. Shortly thereafter, markets around the world experienced their most volatile week since the 2008-09 Great Recession. While the markets have since recovered, faith in US government leadership has not. Moreover, many foreign governments are beginning to question America’s extraordinary privilege of printing the world’s reserve currency as well as immunity to borrow imprudently. America’s reputation for being the world’s economic safe haven is one of its most important assets. Any downgrading, especially if self-inflicted, to our creditworthiness would cause significant damage to our economy and society.
[1] US Treasury, Major Foreign Holders of Treasury Securities, July 2013, http://www.treasury.gov/resource-center/data-chart-center/tic/Documents/mfh.txt
[2] The White House, Office of Management and Budget, The President’s Budget for Fiscal Year 2014, Tables S-4 & S-11, http://www.whitehouse.gov/sites/default/files/omb/budget/fy2014/assets/tables.pdf
[3] Treasury Direct, Interest Expense on the Debt Outstanding, Interest Expense Fiscal Year 2013, http://www.treasurydirect.gov/govt/reports/ir/ir_expense.htm
[4] The White House, Office of Management and Budget, The President’s Budget for Fiscal Year 2014, Tables S-1, http://www.whitehouse.gov/sites/default/files/omb/budget/fy2014/assets/tables.pdf
Abigail says:
I could not resist commenting. Very well written!