
Download PDF Version: Jobenomics 2014 Economic Forecast- 29 Dec 2013
Jobenomics 2014 Economic Forecast
www.Jobenomics.com
By: Chuck Vollmer
29 December 2013
Jobenomics predicts 2014 will be a pivotal year for the US economy. Most economists and government agencies are cautiously optimistic. For example, starting in 2014, the Congressional Budget Office predicts[1] “a virtuous cycle of faster growth in employment, income, consumer spending and business investment over the next few years.” Jobenomics holds a contrarian point of view. As shown below, Jobenomics assesses the following probabilities for the 2014 US economy: 5% chance that the economy will get much better, 18% chance that it will get a little better, 27% chance that it will continue to muddle along, 39% chance that it will get worse, and 11% chance that it will get much worse for reasons discussed in this analysis.
Jobenomics versus Macroeconomics. Most economists foresee the dawn of a new era of wealth creation evidenced by record highs in stock markets and corporate profitability, dropping unemployment rates, growing energy independence and the bottoming of the housing market. While Jobenomics agrees with the upward power of these trends, Jobenomics asserts that the American economy is on an unsustainable path due to a number of structural flaws such as an eroding middle-class, gridlocked fiscal policy, massive increase in able-bodied Americans that can work but are no longer looking, low labor participation rates, decreasing employment-to-population ratios, growing entitlement and welfare subsidies, growing laissez-faire attitude towards government dependency, declining competitiveness in the international marketplace, as well as the growing inability of government to provide security from extremism, terrorism, militancy and conflicts.
Most economists use microeconomics and macroeconomic indicators to forecast the future. Microeconomics is the study of decisions that people and businesses make regarding the allocation of resources, and prices of goods and services within a specific industry. Macroeconomics focuses on national-level behavior and indicators. A macroeconomic indicator is a statistic, such as the official unemployment rate or stock market indices, that measure how well the economy is doing. Economic indicators and statistics are useful in measuring changes to the status quo, but often fall short identifying strategic inflection points and change states in a rapidly changing and interdependent world. The Jobenomics 2014 Economic Forecast attempts to balance strategic issues with macroeconomic indicators with special attention on potential disruptive factors, technologies and events. Analyzing macroeconomic indices and rates within a strategic geo-economic/political/military/social-religious context allows a forecaster to envision multiple outcomes, as opposed to one based on the existing state of affairs.
Small Business. Jobenomics assesses the following probabilities in the strategic area entitled, Small Business: 20% chance that it will get much better, 40% chance it will get better, and 40% that it will muddle along.
Jobenomics believes that small business vitality is a leading macroeconomic indicator. No major political or economic prognosticator includes small business vitality in their repertoire of macroeconomic indicators. After numerous meetings on Capitol Hill and Wall Street, Jobenomics concludes that the dearth of small business leaders and serial entrepreneurs in political office or major financial institutions leads to a lack of understanding and appreciation of this vital component of the US economy.
Small business is the engine of the US economy. According to the US Small Business Administration[2] there are 18,500 big businesses and 27.9 million small businesses with less than 500 employees. These small businesses created the majority of new US jobs over the last two decades—60% by existing small businesses and 40% from the churn of startups minus closures. About half of all new small businesses survive five years or more and about one-third survive 10 years or more. As reported by the ADP National Employment Report (published monthly by the ADP Research Institute in close collaboration with Moody’s Analytics), ADP data indicates that small business is the dominant economic force in terms of employment and job creation. For example, from January 2005 to December 2013, small businesses produced 4,436 million net new jobs, compared to a loss of 727,000 jobs for big businesses.
Today, small businesses employ 77.4% of all private sector Americans with a total of 88.7 million employees—5 times the amount of large corporations (1000+ employees). Very small businesses with less than 19 employees employ 65% more than all large corporations combined (29.7M versus 18.0M).
Since the beginning of this decade, small business has produced 70.6% of all new American jobs. This is an amazing statistic, considering the adverse lending environment by financial institutions, mounting government regulation, and the pittance of federal government stimulus funds allocated to small businesses.
It is a common misperception that small businesses, especially very small (1-19 employees), are the most fragile. The chart (above) indicates that very small businesses have been the most resilient of the five business categories following the Great Recession of 2008.
It is also a common misperception that small businesses are only involved in service-providing industries, whereas large major corporations dominate goods-producing industries. The above chart indicates that small businesses play a major role in both goods-producing and service-providing industries.
Thomson Reuters/PayNet Indices provide valuable insight into the health of small business. The Thomson Reuters/PayNet Small Business Lending Index (SBLI)[3] measures the volume of new commercial loans and leases to small businesses. To create the SBLI, PayNet tracks the new borrowing activity by millions of US businesses as reported by the largest lenders. The Thomson Reuters/PayNet Small Business Delinquency Index (SBDI)[4] measures small business financial stress and provides early warning of future insolvency.
The most recent SBLI and SBDI are shown above. The SBLI indicates that new loan originations to small businesses have increased slowly since the end of the recession and may now be at the point of significant small business expansion, which is very good news for 2014. The SBDI shows that loan delinquencies (31 to 90 days past due) are at their lowest point since 2005. This is also very good news for 2014. Small business creditworthiness is critical to business expansion and jobs creation.
Jobenomics believes the solution to growing America’s middle-class involves putting our small business economic engine into over-drive. Energizing existing small businesses and creating new small and self-employed businesses could create 20 million new jobs within a decade. To prove the validity of this assertion, Jobenomics is working with a number of US cities to implement Jobenomics Business Generators to create thousands of new-start businesses. The objective of a Jobenomics Business Generator is to increase “birth rates” of start-up businesses, extend the “life span” of small businesses, and increase the number of employees per business, which has decreased by approximately 30% since the Great Recession. Jobenomics is focused on four demographics with high growth potential: Generation Y (see Network Technology Revolution discussion in next section), Women-Owned Businesses (http://jobenomicsblog.com/jobenomics-women-owned-business), Minority-Owned Businesses (http://jobenomicsblog.com/minority-owned-businesses and http://jobenomicsblog.com/urban-mining) and Veteran-Owned Businesses (http://jobenomicsblog.com/jobenomics-veterans-centers).
If Jobenomics can help create thousands of highly-scalable small businesses, America writ-large can facilitate creation of millions of small businesses that would transform our economy. 2014 could be a break-out year for small businesses that traditionally have been the primary source of employment for entry-level workers and the long-term unemployed.
Technology Revolution. Jobenomics assesses the following probabilities in the strategic area entitled, Technology Revolution: 17% chance that it will get much better, 67% chance that it will get better, and 17% chance that it will continue to muddle along.
The military technology revolution (MTR) was one of the deciding factors in winning the Cold War and creating the largest and most competitive economic superpower on the planet. The information technology revolution (ITR) in the latter part of the 20th century ushered in a new era of prosperity and international commerce. The emerging energy technology revolution (ETR) and network technology revolution (NTR) have the potential to reshape the global economy. Like the MTR and ITR, the ETR and NTR will likely lead to the creation of tens of millions of new productive jobs, as well as enhance American economic security.
Energy Technology Revolution (ETR). The ETR involves energy independence and energy assurance that incorporates a wide spectrum of transportation and electrical power technologies and systems: vehicle fuel economy, alternative fuel vehicles, alternative fuels, exotic technologies, domestic oil/gas production, renewables, and energy infrastructure and efficiency.
Economies cannot grow without a reliable source of energy. Fortunately, America has abundant sources of energy. Our main challenge is to exploit these resources in an economically and environmentally-friendly way. Our second challenge is to protect our supply of foreign energy resources and mitigate the risks of disruption. Our final challenge is to upgrade our transportation and electrical infrastructure to be economically competitive throughout the 21st Century.
According to the US Energy Information Administration[5], America’s primary energy production is on the rise, which is very good news for the economy. More importantly, this rise appears to be sustainable and very marketable both domestically and internationally. The biggest rise is in natural gas technology due to new hydraulic fracking and horizontal drilling technology. The second largest rise involves renewables (hydro-electric, bio-mass, wind, solar/photovoltaic and geo-thermal). The third involves crude oil production and oil made from natural gas plant liquids. According to the US Department of Energy[6], US crude oil production is expected to approach the historical high achieved in 1970 of 9.6 million barrels/day through 2016, the US Energy Information Administration said in an early release of its Annual Energy Outlook 2014. Energy produced by coal and nuclear power is on the decline.
In 2013, American energy consumption was dominated (82%) by fossil fuels (coal, natural gas, and petroleum), followed by renewables (10%) and nuclear (8%). In the 10% renewables category, the EIA reports[7] that bio-mass was the biggest contributor with 48%, followed by hydro-electric with 30%, wind with 17%, solar/photovoltaic with 3% and geo-thermal with a 2% contribution.
Contrary to popular opinion, highly advertised and politicized wind and solar energy together account for only 2%, versus 82% for fossil fuels. Consequently, the path for US energy independence and economic security will depend on fossil fuel production and consumption for decades to come. New fossil fuel technology will make fossil fuel production much more environmentally-friendly. For example, modern gasification technology can turn even the dirtiest coal into gasoline, diesel and aviation fuels with near-zero emissions.
Regarding energy assurance, according to the US Department of Energy[8], 40% of the oil the US now uses is imported, costing $300 billion annually. Increased domestic oil production from shale formations and improved fuel economy standards have decreased oil imports over the past few years, but America will continue to rely on imports for 35% to 40% of our petroleum needs in the future. Approximately 72% of the world’s oil reserves are concentrated in the Middle East and are vulnerable to disruption. Oil price shocks and price manipulation by OPEC have cost the US economy about $2 trillion from 2004 to 2008. Considering the conflicts and extremism is the Mid-East and Africa, the probability of a global energy disruption is high.
Today, approximately 10 million people are directly and indirectly employed by the US energy sector. Jobenomics believes that the US could produce millions of new domestic jobs if we exploit human and natural resources via the energy technology revolution that is occurring today in the United States. The early release of EIA’s Annual Energy Outlook 2014 forecasts historically high projections in the US energy sector including lower energy prices, increased crude oil and natural gas production, better vehicle efficiency, less dependency on foreign imports, increased efficiency in residential and transportation sectors, lower CO2 emissions, increased industrial and manufacturing output, and increased contribution to US GDP—all good news for the US economy in 2014.
Network Technology Revolution (NTR). For most people who casually use the Internet, their digital world is expressed in terms of kilobytes (103) and megabytes (106). For IT professionals, the digital world is now represented by zettabytes (1021). The age of “big data” is here. In 2013, the World Wide Web passed the 4 zettabyte threshold. So what does the zetta-flood mean to the world’s digital future? Managing gargantuan levels of data is increasingly frustrating due to the complexities and costs of maintaining internal information technology environments. By 2020, the number of data files is projected to grow as much as 75 times, compared to 1.5 times growth of the available pool of IT professionals. As a result, organizations are looking to the promises of cloud computing to help solve issues related to big data and proliferation of the Internet of Things.
Cloud computing is as big a paradigm shift away from personal computers (PCs) as PCs were from mainframes in the 1990s. Cloud computing is the practice of using a network of remote servers hosted on the Internet to store, manage, and process data, rather than a local server or personal computer. To most people, cloud computing is as amorphous as its name suggests. It is not hard to comprehend that most zetta-data will be stored in the “cloud” due to economies of scale and the decreasing cost of virtualized mega-servers in super data centers. However, the “cloud” is much more than storage alone. It also entails security, connectivity, portability, access, and other issues including privacy, legal and regulatory.
Outsourcing of data to massive, centralized data centers seems to be the answer in a world where more things are connected to the Internet than people. The number of Internet of Things is projected to reach 50 billion devices by 2020, which equates to more than six devices for every person on earth. To help interface the zetta-information stored in the cloud with billions of personal digital assistants (smart phones, pads and tablets), service providers are developing a myriad of applications and semantic-web technologies.
The semantic web enables machines to interpret “meaning” in the cloud much in the way humans do. In the beginning, the World Wide Web (WWW) was comprised of non-semantic, read-only websites that focused on data retrieval. Today’s WWW 2.0 websites are semi-semantic, read-write websites that facilitate data sharing as evidenced by social media (Facebook, Twitter, etc.) and blogging. In the near future, WWW 3.0 will introduce fully semantic read-write-execute websites. WWW 3.0 will perform functions for humans in merged virtual/physical worlds represented by physically persistent virtual clouds (avatars) and virtually enhanced physical realities (3D game worlds).
Upgrades to legacy systems, like the 50-year-old Internet, and legacy processes will not work. A new, holistic approach is needed for the zetta-data era, as well as the rapidly approaching yottabyte (1024) era. This new, holistic approach will be defined by the ongoing, highly disruptive and competitive Network Technology Revolution (NTR) that will have a dramatic impact on the world-wide economy and the American way of life.
As a result of the NTR, 2014 will usher in the death of the personal computer. Smart phones, pads and tablets are rapidly replacing personal computers and their related peripherals. These new devises cost hundreds of dollars versus thousands of dollars for personal computers. Billions of dollars that are lost in personal digital equipment sales will be offset by billions of dollars made in subscription services by cloud and application providers. It is not inconceivable that competition will drive the cost of smart devices (phones, pads, tablets) to near zero as an incentive for long-term contracts for services, much in the same way telephone companies do today with cell phone services.
The field of NTR providers and vendors is growing exponentially. The dominant player will likely be the one with the most integrated, secure, low-cost, and digitally portable solution. NTR competition will be fierce between content providers (such as Verizon and Comcast), equipment manufacturers (such as Cisco, EMC, Intel and IBM), software providers (such as Microsoft and Apple), social-networking giants (such as Facebook, Google and Twitter), service providers (such as Amazon and Salesforce.com) as well as niche and emerging players. In the last 18 months, over a dozen niche players have gone public, fetching tens of billions of dollars’ worth of investment capital.
Jobenomics predicts that the Network Technology Revolution will present huge revenue opportunities that will, in turn, help the US economy grow in 2014. Competition will force out weak companies and elevate strong ones. Organization disruptions will be commonplace. Dominant NTR companies currently reside in the US and will have an advantage in the global market place.
Jobenomics also predicts that the NTR will spur the growth of small business. The NTR could be the great business equalizer that allows home-based, self-employed businesses to compete globally. Today, WWW 2.0 social-networks focus mainly on media, entertainment and shopping. Tomorrow’s WWW 3.0 social-networks may be able to monetize the World Wide Web, creating tens of millions of new jobs. eBay, a WWW 2.0 new start in 1995, is now a multi-billion dollar enterprise located in over 30 countries, with 31,500 employees that enable millions of global micro-businesses. If properly planned and supported, WWW 3.0 could create dozens of eBay 3.0-like enterprises.
Stock Markets & Corporate Profitability. Jobenomics assesses the following probabilities in the strategic area entitled, Stock Markets & Corporate Profitability: 14% chance it will get better, 29% that it will muddle along, 43% chance that it will get worse, and 14% that it will get much worse.
The most watched daily metric of US economic health is the US stock market indices, especially the Dow Jones Industrial Average (DOW, top 30 US companies), the Standard & Poor’s 500 (S&P 500, top 500 US companies) and NASDAQ (4000 US stocks). US stock markets are now at historical highs due to a five-year bull market. From the low point during the Great Recession in March 2009, the DOW, S&P 500 and NASDAQ have posted gains of 139%, 161% and 212% respectively. According to most economists and market watchers, US stock markets are poised to go much higher in 2014 based on the inertia of the extraordinary US stock market performance in 2013. Over the last twelve months, the DOW, S&P 500 and NASDAQ posted gains of 21%, 27% and 36% respectively, overcoming tax increases, sequester, Federal Reserve tapering concerns, government shutdown and debt ceiling brinkmanship.
Most economists believe that 2014 will be a banner year for stocks due to less fiscal drag in Washington, the nascent housing recovery, recapitalized banks, reduced household debt, and corporate profitability. While all this is true, Jobenomics is not so sure that 2014 will be a banner year for a number of strategic reasons, including ending of federal stimulus programs, increased competition from foreign equity markets, and changing nature of the US markets.
The big questions facing economists, policy-makers, opinion-leaders and investors are (1) whether this bull market will continue, (2) can stock markets operate under their own power, and (3) how chaotic will the markets become during tapering of US government subsidies? To answer these questions, one must first consider the level of involvement of the US government, especially the actions of the US Federal Reserve Board-the single most important government agency in relation to the stock markets.
Ending of Federal Stimulus Funds. The US Federal Reserve System’s, also known as the Federal Reserve or simply the Fed, engagement on monetary and credit policy has immediate consequences for financial institutions, investors and economic recovery.
As shown, the US government has been stimulating publically-traded financial institutions and corporations to the tune of $16.6 trillion since 2008. Federal Reserve programs totaled $10.9 trillion, mostly for banks, financial institutions, insurance companies and government-sponsored enterprises (Fannie Mae and Freddie Mac—holders of 77% of all American mortgages). US Treasury programs totaled $2.9 trillion, mostly to individuals and the auto industry. Federal Deposit Insurance Corporation (FDIC) totaled $2.5 trillion, mostly for local banks. The US Department of Housing and Urban Development (HUD) totaled $306 million, mostly for homeowners via the Federal Housing Administration. Since the Federal Reserve is responsible for 66% ($10.9 trillion out of $16.6 trillion), it has been the most influential organization in regard to the US economic recovery, as well as the 5-year bull market run.
After 5 years of aggressive engagement via printing money, buying securities and manipulating interest rates, an increasing number of investors fear that disengagement by the Fed may have dire consequences regarding the attractiveness of stocks vis-à-vis other investment opportunities, such as commodities, bonds or even cash. Moreover, many investors fear that the US stock market has been artificially inflated by government involvement and that any tapering by the Fed is likely to cause the stock market bubble to deflate, or burst. Economists, policy-makers and strategic planners are also worried that adverse consequences created by Fed cutbacks could destabilize the global economic balance of power.
In December 2008, the Fed launched a massive liquidity effort by pouring trillions of dollars in short-term lending into financial firms and corporations. A host of new programs was created, including repurchase agreements, term auction credits, commercial paper funding facility, liquidity swaps and various other loans and bailouts. This liquidity effort was designed to be temporary in nature with a minimum risk to inflation. The liquidity effort worked. It saved a number of banks and corporations (such as the automotive industry) from insolvency without creating inflation. This liquidity, coupled with near-zero interest rates, has found its way into the US stock markets, which have now recovered their losses since the recession.
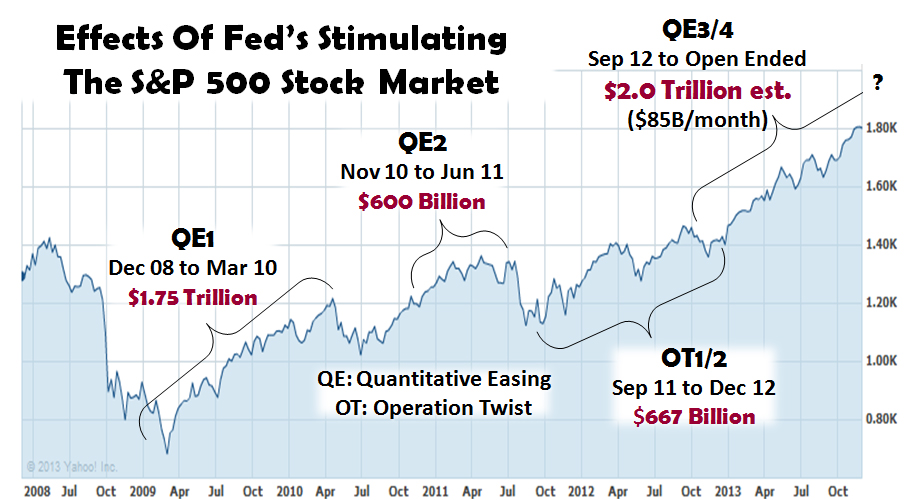
The effect of the Fed’s quantitative easing programs can be seen on the performance of the S&P 500 stock market, which is comprised of America’s top 500 publically-traded companies. As shown on the graph above, every time the Fed initiated a quantitative easing program, the S&P 500 grew significantly. The opposite effect happened when the quantitative easing programs ended—the markets declined. The same happened with other US and foreign stock markets.
QE1 (Quantitative Easing #1) occurred between December 2008 and March 2010 and involved a total of $1.75 trillion dollars’ worth of purchases of toxic mortgage-backed securities ($1.25 trillion) and debt ($200 billion) from Fannie Mae, Freddie Mac, Ginnie Mae and the Federal Home Loan Banks, and $300 billion of long-term Treasury securities. The main purpose was to support the housing market, which was devastated by the subprime mortgage crisis.
QE2 (Quantitative Easing #2)occurred between November 2010 and June 2011 and involved $600 billion dollars’ worth of purchases of long-term Treasuries at a rate of $75 billion per month. Treasuries include treasury bonds, notes, and bills. The Fed buys treasury securities when it wants to increase the flow of money and credit, and sells when it wants to reduce the flow. In essence, after the Fed purchases treasury securities, it adds a credit to member banks, which increases the amount of money in the banking system, and ultimately stimulates the economy by increasing business and consumer spending because banks have more money to lend at lowered interest rates.
OT1/2 (Operation Twist #1 & #2)occurred between September 2011 and December 2012 and involved a total of $667 billion. Operation Twist was a plan to purchase bonds with maturities of 6 to 30 years, and to sell bonds with maturities less than 3 years, which pressured the long-term bond yields downward and extended the average maturity of the Fed’s own portfolio.
QE3/4 (Quantitative Easing #3/#4) started in September 2012 and continues today, open-ended until the economy recovers and the official employment rate drops below 7%. QE3 provided for an open-ended commitment to purchase $40 billion of agency mortgage-backed securities per month until the labor market improves “substantially”. QE4 authorized up to $40 billion worth of agency mortgage-backed securities per month, and $45 billion worth of longer-term Treasury securities. In December 2013, QE4 was reduced from $85 billion to $75 billion/month.
The old adage “make hay while the sun shines” is applicable to corporations and their investors in the stock markets. The Fed Chairman recently indicated that the era of low interest rates, excessive borrowing and quantitative easing is about to end. In other words, the era of easy money is about over and the markets will have to operate with less and less government subsidies. It is clear that the stock markets are addicted to these subsidies and are averse to any withdrawal. On 20 June 2013, the Dow Jones and the S&P 500 had their biggest point losses in more than a year and a half after Federal Reserve Chairman Ben Bernanke hinted that the Fed “could” begin dialing back (tapering) or even ending its economic stimulus in 2014. However, on 18 December 2013, Chairman Bernanke announced that the Fed will reduce QE4 by a modest $10 billion in January 2014, continue “further measured steps” if the economy warrants, and “keep short-term interest rates low” for the foreseeable future. The next day, stocks dipped initially and then closed at record highs. Hopefully, the stock markets will continue to react this way as the Fed continues to slowly wean the markets off the government’s financial milk.
The view held by most economists is that the markets will undergo a period of turbulence but will recover due to structural soundness and historical precedent. Jobenomics asserts that the US economy is not structurally sound. America’s emphasis on investing and speculating, as opposed to manufacturing and producing, has caused the largest creditor nation in the world to decline to the world’s largest creditor nation that is more significantly dependent and less competitive internationally. Jobenomics also asserts that the $16.6 trillion spent by the federal government was not well spent, as evidenced by the low rate of US GDP growth, high unemployment, exponential growth of people leaving the US labor force, our dwindling middle class, and a hundred million US citizens dependent on handouts and welfare payments.
In conclusion, today’s stock market success may be more of an illusion than reality. At some point in time, US federal government subsidies to financial institutions and corporations will end. If the Fed begins tapering its quantitative easing program, interest rates could spike and weigh heavily on stock prices. When that time happens, we will find out if the markets can operate under their own power.
Increased Competition from Foreign Equity Markets. American stock exchanges were once perceived as omnipotent. This is no longer true. There are now several hundred stock exchanges around the world, all competing for global investment dollars. Times are changing.
According to The World Bank[9], the market value of the entire world’s stock exchanges is $53.16 trillion. Market value (market capitalization) is determined by the share price times the number of shares outstanding of all incorporated companies listed on the country’s stock exchanges at the end of year. Investment companies, mutual funds, or other collective investment vehicles (like derivatives, discussed in next section) are not included. US stock exchanges account for $18.67 trillion, or 35% of the total. In 2001, US stock exchanges accounted for 50% of the world total—a drop of approximately 3% per year.
The growth rate of all foreign stock exchanges (excluding the US) over the last decade (2002 through 2012) averaged 178% compared to US growth of 68%. The BRICs (Brazil, Russia, India, and China) grew between 604% and 893%. Mexico grew 409%. Based on the data in these two charts alone, it is clear that US stock exchanges may no longer be the dominant player in the global equities marketplace.
US companies face the highest corporate tax in the world and are subjected to the most complex set of government regulations and oversight. By contrast, countries like the United Arab Emirates (UAE) are aggressively pursuing a strategic approach to attracting investment dollars and relocation of foreign companies. Both Dubai and Abu Dhabi founded exchanges in 2000 that now list thousands of companies. The Dubai and Abu Dhabi exchanges are now growing at rates as much as 80% per year. NASDAQ Dubai opened in late 2005 and is rapidly listing high tech companies around the world with support of 500,000 regional and thousands of institutional investors[10]. In addition to these exchanges, the UAE created major financial centers in Dubai (2004) and Abu Dhabi (September 2013) to promote domestic growth and access to Asia and Middle-East markets. After nine years in operation, the Dubai International Finance Center has 14,000 professionals working with 940 companies.
In November 2013, the ruler of Dubai, Sheikh Mohammed bin Rashid, announced an aggressive plan to be “the new economic centre of the world,” becoming the central East-West-Africa hub for 2 billion people in Europe, Asia, the Middle East and Africa. Abu Dhabi has similar global ambitions to become the world’s go-to financial center. The Abu Dhabi World Financial Market is a financial free zone that: is exempt from federal civil codes; has its own legal structure, financial regulator and courts; offers 50-year tax-free status and full foreign ownership of companies; and has financial support from the Abu Dhabi Investment Authority, the second-largest wealth fund in the world, and Mubadala, the state investment fund. Dubai and Abu Dhabi’s vision of becoming the world’s financial center may not be as farfetched as many believe. Their state-sponsored airlines will soon have the world’s largest passenger fleet supported by the world’s most modern infrastructure and world-class tax-free industrial and business zones.
From a US stock market perspective, international competition is not only on the rise but is exploding. Emerging markets are now competitive for global investment dollars (and other currencies). New stock exchanges, like those in the UAE, are aggressively and strategically luring companies to list on their exchange, as well as relocating operations on foreign soil.
Changing Nature of the US Markets. The American stock market started in 1792 when a small group of men started the New York Stock Exchange to sell shares of companies to raise capital and share risk with outsiders, thereby creating a financial relationship between owners and stockholders. This empowered millions in the middle-class who could own a piece of the “rock” and provide a source for retirement. This owner/stockholder relationship remained relatively constant until the 1980s when exotic financial instruments, called derivatives, were introduced. Powered by the information technology revolution, derivatives skyrocketed. Today, the nominal value of derivatives ($800 trillion) exceeds the market value of all the world’s equities ($52 trillion) by a factor of 16 to 1. The traditional owner/stockholder relationship has largely been replaced by institutional traders who “bet” on the underlying value of stock. In many ways, the tail now wags the dog.
When people invest in a derivative, they are placing a “bet” that the value derived from the underlying asset will increase or decrease by a certain amount within a certain period of time. At the time of purchase, this person signs a binding contract to buy or sell an asset at some point in the future, but pay for it in the present at a locked-in price. To make a bet, the investor or trader does not have to own the asset. To make this point clear, a sports analogy might be useful. A bookie does not have to own a football team to make a bet on the outcome of the game. Nor does an advertising agency, television or radio, all of whom benefit from the underlying asset, in this case the football team. By the time of the Super Bowl, more money is made on the side bets and sideshows than the actual game itself. The same is true on derivatives, which are good for economic growth and hedging risk, unless the game is cancelled, which happened during the subprime mortgage crisis.
Since derivatives have no value themselves, they depend on the value of another asset, called an underlying asset. Underlying assets include mortgages, equities (stocks), commodities (corn, gold, oil, etc.), loans, bonds, interest rates, exchange rates, indices, a host of other assets, and unusual items like the weather. A weather derivative acts as a financial instrument that helps to reduce the amount of risk in the event of bad weather, which is an important risk factor in the agriculture industry. Much in the same way, credit derivatives provide insurance regarding defaults on loans, credit cards, mortgages and other credit products. Investment banks, hedge funds and insurance companies are parties that frequently agree to assume risk associated with credit products.
Warren Buffet has referred to derivatives as “time bombs” and “financial weapons of mass destruction.” Regardless of all the rhetoric and new regulations (Dodd-Franks), the derivatives market has grown since the subprime mortgage crisis that involved “betting” on the underlying value of mortgages owned largely by people with poor credit ratings. On the other hand, there are a small group of economists and financial engineers, like Robert Shiller, who think that derivatives can be beneficial to the common man. Shiller’s Case-Shiller Home Price Indices was designed to help homeowners hedge against risk of declining home prices. Unfortunately, Shiller’s novel ideas of using derivatives for social engineering are still in their infancy.
The equities market is increasingly becoming the playground of the rich and the super-rich. As such, any discussion regarding stock markets should emphasize that fewer and fewer average Americans are playing in this sandbox due to small size, limited capital and adequate tools, like high-frequency trading technology. In addition, most major US companies make more money today on trading secondary markets than they invest in future growth. To see if this statement is accurate for your favorite company, check the Statement of Cash Flows in their annual report. If their Investing Activities and Financing Activities are greater than their Operating Activities it is likely that they are making more money on money than on the products and services that they sell.
Jobenomics believes that as long as the big game in town involves speculation in derivatives (hedging and side bets), rather than investing in the underlying asset (companies), stock markets are more risky than most commonly used macroeconomic indicators would reveal. Today’s stock markets are more suited for high-risk/high-reward casino capitalists than the average John or Jane Doe whose main interest is securing their retirement. The financial engineering used in derivatives could be used to benefit many more Americans. For example, the value of an individual’s income and assets (homes and property) are worth many times the value of the stock markets. Using modern information and network technology (à la the ITR and NTR), derivatives and other financial instruments could be used to reduce the risk of income and asset loss of average Americans. If Wall Street continues to focus its energy on the top 1% and large institutional investors, stock markets will become increasing irrelevant to the general public and social good.
GDP & Consumption-Based US Economy. Jobenomics assesses the following probabilities in the strategic area entitled, GDP & Consumption-Based US Economy: 67% chance that it will muddle along and 33% chance that it will get worse.
Gross Domestic Product. Gross Domestic Product (GDP, the sum of the value of all goods and services) is a major macroeconomic indicator for a nation. Modern economies have to grow in order to prosper. Since the end of the Great Recession, the US economy has grown by an anemic rate of 2.2% per year with 2013 being one of the weakest at 2.0% due to myriad challenges with the federal government over fiscal policy and structural weakness in the private sector.
Most economists believe that the headwinds of 2013 have largely subsided and a new era of American prosperity is likely to commence in 2014. These economists point to a number of positive trends including stronger banks, corporate profitability, bull stock markets, increasing household disposable income, improved housing market conditions, more energy independence, better export conditions due to a weaker dollar, reduced cost-cutting by state and local governments, reduced economic brinksmanship in Congress, Eurozone emerging from recession, and increased trans-Pacific partnerships. Based on these positive trends, these economists and policy-makers anticipate that US GDP growth will be in the 2.5% to 3.0% range.
On the other hand, a small number of macroeconomists are not so optimistic. For example, Lawrence Summers, former Secretary of the Treasury and almost Chairman of the Federal Reserve, stated in a speech to the International Monetary Fund on 8 November 2013 that the US could be entering a period of “secular stagnation” where the economy fails to create enough demand (consumption) and needs bubbles (stock market) to achieve full employment. He also stated that “conventional macroeconomic thinking leaves us in a very serious problem” given the Fed’s inability to effectively grow the economy since the nation’s “natural interest rate” is now substantially below zero percent (see discussion in next section entitled Monetary Policy).
Jobenomics agrees that the headwinds of 2013 have largely subsided, but 2014 will usher in a number of new challenges limiting US GDP growth to 1.5% to 2.0%. 2014 will be a make or break year for the Patient Protection and Affordable Care Act (ObamaCare), the healthcare industry, as well as the President himself. 2014 is likely to be the year where the federal government’s $17 trillion dollars’ worth of bailouts, buyouts and stimuli will end and the US economy will have to operate under its own power.
2014 could be the year where US structural economics flaws reveal that Americans are not as competitive as they once were due to education, labor force, innovation, business and capital constraints. For these reasons, plus other strategic reasons addressed in this forecast and on the Jobenomics website (www.Jobenomics.com), Jobenomics believes that 2014 will be a pivotal year for the US GDP in terms of producing value-added and competitive goods and services.
When it comes to US GDP growth predictions, the US Federal Reserve System (the Fed) is the ultimate authority. Not only does the Fed have the necessary analytical tools, it can establish monetary policy, increase or decrease the money supply, raise or lower interest rates, and provide forward guidance to economists, policy-makers and opinion-leaders.
So just how accurate has the Fed been in forecasting US GDP growth? Not very, according to the meeting minutes of the Fed’s Federal Open Market Committee (FOMC) that conducts quarterly meetings to review economic conditions, determine monetary policy, assess risks to sustainable economic growth, and make projections on US GDP growth.
This chart, created by Jobenomics, is a snapshot of US GDP projections by the Federal Reserve Governors and Reserve Bank Presidents[11] as recorded by their past Federal Open Market Committee meeting minutes. The last 20 FOMC meetings are shown on the left column and their US GDP projections for the current and future years are shown for years 2009 through 2016. Actual US GDP growth is shown in yellow at the bottom of the chart. Let’s take a look at the Fed’s US GDP projections over the last three years:
- For year 2011, the Fed forecast a high GDP growth rate of 5.0% in January 2009, which was revised down to 4.5% in January 2010, and revised down again to 3.9% in January 2011. The actual 2011 GDP growth was 1.8% according the US Bureau of Economic Analysis[12].
- For year 2012, the Fed forecast a high of 4.8% in November 2009, revised down to 4.5% in January 2010, revised down to 4.4% in January 2011, revised down to 2.7% in January 2012, and revised down to 1.8% in December 2012. The actual 2012 GDP growth was 2.8%.
- For year 2013, the Fed forecast a high of 4.6% in November 2010 and again in January 2011, revised down to 3.2% in January 2012, revised down to 3.0% in December 2012, and revised down to 2.3% in September 2013. The estimated 2013 GDP growth is 2.0% as of December 2013.
As evidenced by these consistent downward revisions, the Fed has been consistently more optimistic than realistic about the US GDP and the US economic recovery since the Great Recession. Consequently, the Fed’s latest FOMC (September 2013) projection for 2014 US GDP growth is in the 2.9% to 3.1% range (down from a high of 3.9% in November 2011), which may be overly optimistic.
Outside of the FOMC projections, the Federal Reserve Bank of Philadelphia (one of the 12 regional Federal Reserve Banks) conducts an annual survey of 42 leading private sector economic forecasters. Survey of Professional Forecasters[13] (the oldest quarterly survey of US macroeconomic forecasters started in 1968) projects US GDP growth in 2014 at 2.6%[14]. Jobenomics asserts that 2.6% is also optimistic since many of these forecasters use the Fed’s projections as their baseline and make adjustments based on a variety of macroeconomic indicators that are influenced by the Fed. Consumer confidence, retail sales, and industrial production are macroeconomic indices that are largely influenced by the Fed’s handling of interest rates and money supply.
Another reason for the Fed’s optimistic projection has to do with unemployment, which is part of the Federal Reserve’s charter. The Fed pledged not to increase interest rates until the official unemployment rate drops to 6.5%. In order to increase hiring, the Fed must encourage personal consumption and expenditures that are the driving forces of the consumption-based US economy. According to Lawrence Summers, this might not be possible in today’s period of “secular stagnation”.
Consumption-Based US Economy. Consumption is defined as the value of all goods and services bought by people. Leading economists determine the performance of a country in terms of consumption level and consumer dynamics. The underlying theory of a consumption-based economy is that progressively greater consumption of goods is economically beneficial. Jobenomics believes that this theory is only partly true. Production, not consumption, is the true source of wealth. Production uses resources to create goods and services that are suitable for use or exchange in a market economy. If America wants a healthy economy, we need to create the conditions under which producers (businesses, as opposed to governments) can accelerate the process of creating wealth for others to consume and finance future production.
The US is a consumption-based society where spending and consumption of goods and services are essential to economic health. The overwhelming percentage of GDP is generated by personal consumption and expenditures as shown above. The Fed reports monthly[15] on the various components of the US GDP. At the end of the third quarter of 2013, personal consumption and expenditures was $11.5 trillion out of a total GDP of $16.9 trillion, or 68% of the total. Government consumption, expenditures and investments amount to $3.1 trillion, or 19% of the total. Private domestic investment (mainly businesses and real estate investments) accounts for $2.7 trillion, or 16%. The final component is net US imports/exports, which is a negative $500 billion (-3%) since foreign imports exceed US overseas exports in our consumption-based economy. US personal consumption rose over the last seven decades as a percentage of US GDP—ranging from a low of 62% to a high of 68% today.
The strategic questions facing economists and policy-makers alike are: (1) can America sustain ever-increasing rates of consumption in an ever-changing geo-political/economic environment, and (2) what are the consequences of a reduced consumption-based economy?
Regarding the first question about the sustainability of our consumption-based economy, Jobenomics assesses the short-term outlook as favorable and the long-term outlook as unfavorable. The long-term outlook could be made much more favorable if the American populace and their elected leaders exploit the advantages of the US labor force and solve a number of significant challenges facing US economic growth.
American economic advantages include inertia, innovation, adaptability, natural resources, and the dollar as the world’s reserve currency. Challenges include debt, political gridlock, financial disruptions, workforce exodus, eroding middle-class, and changing demographics (e.g., retiring baby boomers). Regarding the second question about the consequences of a reduced consumption-based economy, Jobenomics believes it depends on how the US economy is managed or mismanaged; the consequences of reduced consumption can range from benign to malignant. The longer the US waits to implement meaningful reforms to our long-term challenges, the more severe the consequences of reduced consumption. For a more detailed discussion on sustainability, see http://jobenomicsblog.com/consumption-based-economy.
Unemployment is directly tied to consumption. One can roughly calculate the consequence of a relatively minor drop of 5% in consumption and its impact on unemployment. A 5% reduction in the US $16 trillion annual GDP would precipitate a loss of approximately 20 million jobs ($16 trillion GDP x 5% = $800 billion/$40,000 annual median personal income = 20,000,000 jobs). Today, the US employs a total of 136 million citizens, so a reduction of 20 million jobs would equate to approximately 15% of the US work force. If the layoffs were focused on the poor and the lower middle class making an average personal income of $20,000, the numbers could double.
As estimated by the US Bureau of Economic Analysis[16], personal consumer spending has reached an all-time high of $11.5 trillion in 2013. From 1959 (earliest BEA records) to 1970, consumption of goods exceeded services. After 1970, services rapidly exceeded goods. Today, the US consumes $7.6 trillion worth of services and $3.9 trillion worth of goods. In other words, the US is a services-oriented, consumption-based society by a factor of almost 2 to 1.
Americans consume a vast variety of goods and services[17] with healthcare (21.0%), housing (18.8%) and transportation (10.2%) topping the list. Surprisingly, Americans spend more on entertaining themselves (recreation and entertainment, 8.9%) than they do on groceries (food and beverages, 8%)—a sign of “conspicuous consumption”.
America has a consumption conundrum. On one hand, the US economy is dominated by consumption (68%) that must be maintained in order for the economy to prosper. On the other hand, conspicuous, unneeded or unessential consumption without the ability to repay results in spiraling indebtedness, inflation, higher interest rates, defaults, and even bankruptcy. Approximately 50,000 businesses and 1 million individuals file for bankruptcy each year[18]. Bankrupt major cities, like Stockton CA, Harrisburg PA and Detroit MI, indicate that something is amiss.
2014 will be a make or break year for healthcare reform. Healthcare accounts for 21% of US personal consumption and expenditures, or approximately $2.4 trillion. The Patient Protection and Affordable Care Act (ObamaCare) is off to a rough start and faces significant challenges in 2014 and 2015. Its demise would be disastrous for GDP growth. The healthcare industry, healthcare service providers, insurance companies and businesses have already implemented changes to be compliant with the new universal healthcare law. Any major reversals in course would add uncertainty, increased costs, and the loss of consumer confidence.
2014 is likely to introduce major changes to the second largest consumer segment of housing, utilities and fuel that accounts for 18.8% of consumption. While most economists emphasize positive trends in residential construction and lower energy prices, one cannot rule out negative effects caused by restrictive lending practices and disruption of foreign energy sources. While the Fed promises to keep short-term interest rates near zero through 2015, Fed tapering of their $75 billion/month quantitative easing program could cause significant turbulence with banking and lending institutions. Likewise, while the US is making significant progress on becoming energy independent, America is still largely dependent on imported foreign oil. Escalation of ongoing Middle-East conflicts could cause a major disruption of foreign oil imports. Any such disruption would also have a dramatic impact on the US transportation consumption, the third largest sector, accounting for 10.2% of consumption.
Jobenomics concludes that consumption drives GDP and that most GDP indicators err on the side of increased consumption. To sustain a growing economy, government, financial institutions and corporations must motivate citizens to keep consuming to preserve our way of life. Modern-day Americans are programmed to be good consumers. It is estimated that an average American child watches 20,000 TV commercials per year. By age 65, the average American has watched 2 million commercials. We are programmed for excessive-consumption for special occasions, like Christmas that evokes $80 billion worth of gift-giving. When an event like 9/11 or the Great Recession happens, the federal government steps in and encourages consumption. The Monday following the 9/11 Trade Tower attacks, the White House encouraged Americans to continue shopping due to fears that Wall Street would falter if consumer confidence plummeted. At the advent of the Great Recession, the federal government implemented $17 trillion worth of bailouts, buyouts and stimuli to keep financial institutions and corporations afloat in order to stimulate our consumption-based economy. The bottom line is that the US may very well have a consumption bubble. Reducing pressure will help the bubble deflate. Continuing to increase pressure may cause it to pop.
From a Jobenomics perspective, there is only one overarching macroeconomic indicator that is paramount to growing our consumption-based economy. That indicator is employment. Only the employed have the ability to generate wealth and consume over the long-term. Welfare and other government subsidies only provide sources of short-term capital. Given the explosive rate of people becoming dependent on government handouts, these subsidies are not financially sustainable and pose a major drag on GDP growth. As addressed in the Unemployment & Employment section of this report, the number of people currently leaving the US labor force exceeds the number entering by a factor of 4 to 1, which will not help in maintaining or growing our consumption-based economy.
Monetary & Fiscal Policy. Jobenomics assesses the following probabilities in the strategic area entitled, Monetary & Fiscal Policy: 33% that it will continue to muddle along and 67% chance that it will get worse.
In the US, monetary policy is the domain of the Federal Reserve, and fiscal policy of the US Congress (and the US Treasury). Monetary policy relates to the supply of money, which is controlled via factors such as interest rates, reserve requirements for banks, printing and borrowing money, and acquiring toxic assets. Fiscal policy relates to controlling economic growth via taxation and government spending. Working together, monetary and fiscal policy-makers can expand economic growth during slow periods, or contract growth when the economy is overheating. Unfortunately during this current period of slow economic growth, US fiscal policy-makers in Congress are gridlocked in a bitter ideological divide that is likely to remain unabated or grow worse in 2014. Doing the job of a one-armed paperhanger, the monetary policy-makers at the Fed have been able to keep the economy growing slowly using every stimulus tool available. However, 2014 will introduce two major challenges in the Fed, (1) the retirement of Chairman Ben Bernanke, who has piloted the US economy through the roughest financial era since the Great Recession, and (2) the likely tapering or cessation of trillions of dollars’ worth of economic stimulus.
Monetary Policy. As discussed in the book, entitled Jobenomics, and ongoing Jobenomics blogs, Jobenomics has been and continues to be a big supporter of Federal Reserve’s Chairman Ben Bernanke. Jobenomics is also a supporter of Janet Yellen, the Vice Chair of the Board of Governors of the Federal Reserve System and nominee for the new Chairman to replace Ben Bernanke whose second term expires in January 2014.
When confirmed, Chairman Yellen will face a number of significant challenges. Her biggest challenge will be maintaining control of the Fed, both from within and without. Chairman Bernanke had the advantage of being the captain of the ship prior, during, and after the Great Recession. Few people challenged his leadership during this critical period. Chairman Yellen will take the helm in a fragile US economy, with less power to stimulate and influence, and with increasing internal and external opposition.
Many of the tools available to Chairman Bernanke will not be available to Chairman Yellen, who will have to play out the hand dealt to her by her predecessor:
- Chairman Bernanke lowered short-term interest rates to near zero to stimulate lending and spur a strong economic recovery. Chairman Yellen will have to maintain near-zero rates until the economy improves. Many economists feel that an early interest rate raise will choke recovery, cause a panic, and throw the global community back into recession. The ideal time for the Fed to raise rates is when the public generally perceives that the recovery is well in hand. Conversely, Chairman Yellen cannot cut the nominal rate below zero because people will choose to hoard money instead of putting it in the bank. If another downturn or recession hits, Chairman Yellen will have less power than her predecessor since rates are already at zero.
- Chairman Bernanke’s aggressive policy of printing money and buying Treasuries is approaching unsustainable limits. Chairman Yellen will have to manage the consequences of her bloated central bank’s books that have gone deeper in the red by over $3 trillion in the last five years.
- Chairman Bernanke’s quantitative easing tools (QE1, QE2, OT1, OT2, QE3 and QE4) have run their course. Chairman Yellen will be responsible for tapering and withdrawal of addicted financial institutions, stock markets and corporations.
- Chairman Bernanke set expectations that the unemployment rate would fall below 6.5%. It hasn’t and Chairman Yellen will have to make it happen.
- Chairman Bernanke was fortunate that inflation did not spike. Chairman Yellen is considering making inflation one of her top priorities. She also has to face the prospect of deflation, which has plagued Japan for the last 30 years.
- Chairman Bernanke was able to encourage private sector investment in an era of easy money. This era is largely over and Chairman Yellen will face a significant challenge persuading investors if the economy does not significantly improve in 2014.
- Chairman Bernanke enjoyed a relatively stable membership in the policy-setting FOMC, which consists of 7 governors and 12 regional bank presidents. Chairman Yellen will not only face the retirement of the legendary Bernanke, but will have to establish her leadership in the face of 10 new governors and bank presidents—a challenge no new chairman has ever faced.
As shown, corporate profitability is at an all-time high. It has tripled since the Great Recession. Corporate profitability can be directly tied to the Fed’s involvement. First, low interest rates encouraged investors to buy stocks as opposed to traditional investments like savings accounts, certificates of deposits (CDs) and money market accounts due to their low rates of return that are directly tied to the near-zero Federal Funds Rate. Second, corporate bonds (even those rated as junk bonds status) offering meager dividends (compared to savings, CDs and money markets) sold briskly, allowing corporations to build up their cash reserves and profitability. Rather than hiring or recapitalizing, many corporations used this cash for mergers, acquisitions and share buy-backs that increased their profitability. In most cases, these corporate actions were wise financially. Corporate officials know that the “era of easy money” stimulated by the Fed will eventually end, and building up cash reserves was fiscally responsible until the US economy shows real signs of recovery. Whether this will happen in 2014 is a matter of speculation.
Another important aspect of the “era of easy money” is its effect on the economies of emerging markets. The phenomenal growth in the world’s largest emerging markets was largely due to binging on the large amount of money and cheap sources of credit (via low interest rates) that the Federal Reserve and other central banks dumped on the global economy. Over the last five years, Chinese, Indian, Brazilian and Turkish financial institutions lent heavily to corporate high-risk projects and consumers with poor credit. Now that their economies are cooling, the downturn in “easy money” could create a perfect storm for collapsing banks that are facing significant loan delinquencies and defaults. The bottom line is that the central banks (with the US Federal Reserve being the biggest culprit) have caused bubbles in emerging markets akin to the US sub-prime mortgage crisis bubble, that was fueled by poorly qualified loans to people with the least ability to financially survive downturns. The amount of money at risk is huge, averaging 20% to 30% of GDP in many of these major emerging markets. If central banks taper stimuli or increase interest rates, investment capital will flee emerging markets, especially in those countries with large current-account deficits. Financial crises around the world tend to infect other economies.
In 2014, corporate officials will have a laser-focus on Chairman Yellen’s transition and forward guidance. Without a substantial 2014 GDP growth above 2.9% to 3.1% (the last FOMC projection), unemployment rates below 7% to 6.5% (Fed benchmarks), and stable rates of inflation, corporate officials are likely to remain bearish on hiring and recapitalization. Financial institutions also likely will be as bearish on loans, especially to small businesses that employ 71% of US workers.
In summary, 2014 will be a crucial year for the Fed and its monetary policies. The US is fortunate to have an experienced and qualified nominee like Janet Yellen. Hopefully, the 10 new voting members will establish allegiance to the new chairman, but this is not a given. Hopefully, the economy will improve and Chairman Yellen will not have to rely on exhausted tools that have kept the economy afloat, but this is not a given. Hopefully, Chairman Yellen will no longer have to function as a one-armed paper hanger and the Congress will help with meaningful fiscal policy, but this also is not a given, considering the ideological divide in Congress.
Fiscal Policy. US fiscal policy is largely the responsibility of the US House of Representatives, the “holders of the purse strings,” who regulate government spending and tax revenues.
When leading economists cite “less government fiscal drag” as a key factor for their optimistic economic outlook, they believe that the political brinksmanship between Congressional Republicans and Democrats is largely in the past. 2013 was a year of tightening fiscal policy that resulted in a debt ceiling crisis and a government shutdown that generated anxiety and condemnation. Most economists believe that a 2014 budget crisis is unlikely and expect faster growth from an improved policy environment. The American public is not as optimistic. According to a recent national poll of US adults[19], 65% believe that there will be another government shutdown in 2014. This sentiment was shared equally amongst Democrats (66%), Independents (65%) and Republicans (66%). The majority of those polled believes that the 2013 shutdown caused significant economic harm and that it will likely happen again in 2014.
While political brinksmanship may be less, the ideological divide continues unabated. From a Jobenomics perspective, the focus has merely shifted from debt issues to the mid-term elections that involve all House members and 1/3 of the Senate. Democrats and Republicans alike believe that they have a reasonable chance of winning both the House and Senate in 2014. The Democrats need to take 17 seats to win the House and the Republicans 3 seats to win the Senate. With so few seats at stake and the prize so high, it is unlikely that either party has much incentive to cooperate with the other party to pass meaningful legislation on the economy, as well as other major issues. On the surface both parties will appear to be bipartisan for public consumption, but inside Washington, political maneuvering and mudslinging will likely rule the day.
A recent New York Times article[20], entitled Look How Far We’ve Come Apart, addressed the severity of the political divide in our country. Polarization between our two main political parties (shown above) has grown to the point of political paralysis. Washington has reached a crossroads where the left no longer believes anything the right has to say, and vice versa. The article also indicates that the US public is similarly divided, almost to the extent that America was divided prior to the American Civil War. Political scientists Keith Poole and Howard Rosenthal[21] analyzed 13 million individual roll call votes spanning the two centuries since Congress began recording votes in 1789, and concluded that over 81% of Congressional voting decisions can be attributed to a consistent ideological position ranging from ultra-conservatism to ultra-liberalism. They also concluded that members of Congress are now less likely to vote against their party than any time since the first decade of the 20th Century (1900 to 1910).
A study conducted by former Congressman Tom Davis[22] in November 2013 came to the same conclusion. According to the Davis study, in 1982, 79% of the members of the US House of Representatives were considered moderates according to their voting record. By 1994, this number shrunk to 58%. By 2002, it was 31%. Today, it is only 4%. The Senate also followed suit. In 1982, 58% of the members of the Senate were moderates. By 1994, this number shrunk to 34%. By 2002, it was 7%. Today, it is 0%.
GovTrack.us, a tool by Civic Impulse, LLC, is one of the world’s most visited government transparency websites that track bills in the US Congress, as well as each representative’s legislative record. The chart below is GovTrack’s “Ideology Analysis of Members of Congress”[23] from 1 June 2006 to 20 December 2013.
The ideology analysis assigns a liberal–conservative (left-right) score to each Member of Congress based on which bill they sponsored or cosponsored. Data is updated daily and weekly and the charts (above) are interactive for citizens to check the Ideology Score for each representative. The data shows that the Democrats vote en masse according to their left-leaning ideology and the Republicans likewise, except to the right. It is clear from this data and other analyses cited above that the ideological divide in Congress is real and much worse than many people realize. Consequently, it is hard to believe that any meaningful kind of ideological détente is happening.
The reality is that political parties hold far more power than the members of Congress. Party discipline, loyalty and control are paramount. Rogue members risk sanctions and access to key committee and subcommittee positions. Party ideology and party control dominates the House’s business. As stated by Frances Lee[24], a political scientist, “Control of the institution enables a political party to further its member’s political goals of winning office and yielding power, as well as its ideological goals…It leads members of one party to support efforts to discredit the opposition party on the grounds of its incompetence and lack of integrity….to steer the congressional agenda towards issues that allow themselves to differentiate themselves from their partisan opposition.”
In 2014, lawmakers will face a number of significant fiscal policy challenges to include reductions in spending, a continuing resolution that provides government funding (government shutdown in March) and a statutory limit on federal debt (debt ceiling increase in May). The “Bipartisan Budget Agreement” cut in December 2013 by Rep. Paul Ryan (R-Wis.) and Sen. Patty Murray (D-Wash.) offered a glimmer of hope for bipartisanship, but reduced a $1 trillion deficit by only $23 billion over ten years—a 0.2% decrease. In 2014 and 2015, the budget agreement actually adds $63 billion each year, which means the savings will be realized (maybe) sometime in the future.
To better understand long-term deficit reduction issues, Jobenomics created the following charts from data taken from current and historical White House fiscal documents[25].
According to White House budget data, over the last twenty years there have been only four years where the US federal government spent less than they received in tax revenues (surplus). As shown above, the Clinton Administration spent a net $300 billion more (deficit) than it received during the eight years the president was in office. The Bush Administration spent $2.0 trillion more (deficit) than it received in eight years in office. The Obama Administration reports that it spent $5.3 trillion more (deficit) than it received in first four years in office and projects a total deficit of $8.4 trillion over both terms in office.
As shown above, the White House’s future deficits projections have been significantly understated. For example for 2013 highlighted in yellow, the initial Obama Administration’s FY10 budget projection was $512 billion compared to its FY14 Budget that showed the actual deficit at $919 billion—a $407 billion or 79% increase. It is these kinds of gross disparities that infuriate fiscal conservatives who believe that the US is headed for fiscal collapse.
While the latest figures for 2013 are still being tallied, the US federal deficit in 2013 is approximately $1 trillion with receipts of $2.7 trillion versus spending of $3.7 trillion. Individual income taxes and social insurance and retirement receipts (FICA taxes) account for 81% of the federal government’s income. On the spending side, mandatory spending for entitlements (mainly Social Security, Medicare and Medicaid) represents 60% of the total. Appropriated spending (the money set aside each year for running the government and armed forces) accounts for 34% and interest payments on money borrowed by the federal government for the remaining 6%.
In conclusion, the US fiscal policy sea state will remain largely unchanged in 2014. Highly visible political headwinds of 2013 will be replaced by turbulent underwater currents. The two parties will remain ideologically divided. An aura of fiscal policy détente will be portrayed to the public with enhanced political positioning for the 2014 elections. Consequently, Jobenomics predicts that little meaningful fiscal policy actions will occur in Congress to help the economy improve in 2014. The lack of pain experienced in 2013 does not constitute healing in 2014. 2014 will be dominated by minority party (Republicans in the Senate and Democrats in the House) efforts to take control of their respective institutions. It is highly likely that political rhetoric will become even more rancorous and belligerent as the November 2014 election date approaches. If this happens, the US economy will suffer.
Unemployment & Employment. Jobenomics assesses the following probabilities in the strategic area entitled, Unemployment & Employment: 11% chance that it will get better, 22% chance that it will continue to muddle along, 56% chance that it will get worse, and 11% chance that it will get much worse.
Macroeconomists, as well as politicians and pundits, focus heavily on the official unemployment rate statistic, called the U3 rate. Jobenomics tracks all six U-rates (U1 for long-term unemployed, to U3 for the “officially” unemployed, through U6 for the underemployed and unemployed), but focuses mainly on the number of employed—a truer indicator of economic health. Jobenomics asserts that the U3 rate is widely misunderstood, misleading, and undeserving of the amount of attention it receives from economists, policy-makers and opinion-leaders. Jobenomics asserts that there should be an equal emphasis on those Employed, Not-in-Labor Force, and Unemployed—the three major BLS labor force categories
Civilian Noninstitutional Population Labor Force Trends. The Bureau of Labor Statistics reports monthly on three categories: Employed, Unemployed/Underemployed, and Not-in-Labor-Force. People with jobs are Employed. People who are jobless, looking for jobs, and available for work are Unemployed. Those who are marginally employed, and looking for jobs, are deemed Underemployed. People who are neither employed nor unemployed are not in the labor force. Those who have no job and are not looking for a job are counted in the BLS’ Not-in-Labor-Force category. These three categories comprise the Civilian Noninstitutional Population which is defined as citizens, who have jobs or are seeking a job, are at least 16 years old, are not serving in the military and are not institutionalized. Today, the Civilian Noninstitutional Population equates to 246 million people out of a total population of 317 million.
The growth of three categories in the Civilian Noninstitutional Population is depicted above from January 2000 to December 2013. While the growth of the Officially Unemployed has grown by 5.3 million, it is a relatively small number compared to Employment growth of 9.9 million and a phenomenal growth of 22.6 million able-bodied Americans who can work, but don’t, and are now in the Not-in-Labor-Force category. Rather than focusing mainly on the unemployed, Americans should focus more on stimulating employment growth and minimizing those who are voluntarily leaving the work force. Consequently, taken alone, the U3 rate statistic is a very poor indicator of economic health.
Not-in-Labor-Force. When a discouraged worker stops looking for work, that person is no longer counted as unemployed by the BLS, and they moved into the NiLF category. This accounting practice distorts the true number of unemployed. From a Jobenomics perspective, a frustrated person who quits looking is as equally unemployed as one who is still looking. Since Not-in-Labor-Force workers are not counted as unemployed, the official unemployment rate could theoretically be zero if all the current unemployed people simply quit looking for work and joined those in the Not-in-Labor-Force.
Another way to look at the employment/unemployment situation is by analyzing US labor force gains and losses, not including the ranks of the unemployed. According to the Bureau of Labor Statistics (BLS) over the last year, total nonfarm payroll employment increased by 2,293,000 while the number of people voluntarily leaving the labor force and no longer looking for a job was 2,300,000—a net loss of 7,000. Since the start of the Obama Administration in 2009, the US has suffered a net loss of 8,495,000 people. Since the year 2000, almost 4 times as many people departed the US labor force as entered it, for a net loss of 16,501,000. If these rates continue, Jobenomics calculates that those who choose not to work will outnumber those who work by the year 2020. These losses are in addition to the 22 million unemployed or underemployed.
Eroding Middle-Class. A lot has been said in the media about the eroding American middle-class, but few use any metrics to measure this erosion. Labor force participation rates and employment-to-population ratios are two indices rarely used by macroeconomists.
The BLS’s labor force participation rate[26] is the percentage of working-age persons who are employed or unemployed but looking for a job. The BLS’s Employment-Population Ratio[27] answers the question, “what portion of the working-age population is employed?” and is useful in understanding how our economy is performing. Since the year 2000, the US labor force participation rate has suffered a serious decline from a high of 67.3% to 63.0% today—a 6.4% decline from the peak and rate that was last seen in March 1978. During the same period of time, the Employment-Population Ratio dropped by 9.4%. The primary reason for these dramatic drops is largely due to those who simply have quit looking for work and are now categorized as Not-in-Labor-Force. Alarmingly, the BLS reports that 93% of the people in the Not-in-Labor-Force category currently do not want a job now.
Over the last 40 years, according to a 2013 study by Cornell University[28] on the eroding middle class, the share of families living in middle-income neighborhoods declined from 65% to 42%. At the same time, both affluent and poor neighborhoods doubled in size (7% to 15%, and 8% to 18%, respectively).
Over the last dozen years, median household income has also declined[29] from an all-time high of $56,080 in 1999 to $51,017 in 2012—a decline of 9.0%. Unless this trend is reversed, America will increasingly be a nation of haves and have-nots due to an eroding middle-class.
Focus on Employment and Growing Industries. For six decades, the US consistently produced tens of millions of new jobs per decade. Then the bottom fell out in the decade of the 2000s with a loss of 1.2 million jobs. It is critical that significant numbers of jobs are created this decade (2010s) for the US economy to recover. 20 million new jobs by the year 2020 is a reasonable goal. Not only has 20 million been historically achieved, but this is the number needed to accommodate 16 million new labor force entrants per decade and to reduce 4 million unemployed in order to achieve the so-called full employment rate of 5%.
While the US has enjoyed some employment growth since the beginning of this decade, America is only producing 63% (37% shortfall) as many jobs as needed. The US produced only 7,392,000 jobs compared to the 11,750,000 jobs needed as measured against the traditional benchmark of 250,000 jobs per month. Of the three employment sectors reported by the Bureau of Labor Statistics, the private sector’s service-providing industries created 7,052,000 jobs, the private sector’s goods-producing industries created 963,000 jobs, and the government sector lost 623,000 jobs.
The 30-year trend in US employment has overwhelmingly been in the service-providing industries with a 30-year growth rate of 88%. Not surprisingly, government has also grown significantly at a rate of 37%. The US goods-producing industries have declined 16% during the last thirty years.
Today, 136,795,000 Americans are employed in government and the private sector. 96,159,000 (70.3%) work in private sector service-providing industries. 18,749,000 (13.7%) are in private sector goods-producing industries that include Manufacturing, Construction and Mining/Logging. 21,857,000 (16.0%) Americans work for government at the federal, state and local levels.
83.8% of all new jobs this decade were produced by four industries (Professional and Business Services, Trade/Transportation/Utilities, Education and Health Services, and Leisure and Hospitality) in the service-providing sector. Much-touted manufacturing only contributed 6.7% of the US employment growth. The non-internet information industries and government lost jobs this decade.
According to the most recent BLS Job Openings and Labor Survey[30], there were 4.2 million job openings that are available but unfilled largely due to inadequate skill levels from applicants. This survey includes estimates of the number and rate of job openings, hires, and separations for the nonfarm sector by industry and by geographic region. As shown above, the four occupations that had the largest number of openings are Professional & Business Services (777,000), Retail & Wholesale Trade (625,000), Healthcare (593,000), and Accommodation & Food Services (517,000).
Today, out of a total population of 317 million Americans, the US has 105 million taxpayers (33%) working in the private sector who support 32 million government workers (including 10 million government contractors), 21 million unemployed or underemployed (BLS U6 rate) workers who are looking for work, 91 million able-bodied people (Not-in-Labor-Force category) who can work but are not looking, and 68 million (mainly children, retired and disabled) who cannot work. The US economy cannot be sustained by 33% supporting an overhead of 67% via a combination of welfare, entitlement, familial and charitable programs.
In conclusion, Jobenomics believes that the U3 rate is a poor macroeconomic indicator. Sooner or later, the American people will figure out that the current way our government calculates U3 unemployment is seriously flawed. Under the current system, it is theoretically possible for the US to have a zero rate of unemployment while simultaneously having zero people employed in the labor force. Stated another way, since Not-in-Labor-Force workers are not counted as unemployed, the official unemployment rate could theoretically be zero if all the current unemployed people simply quit looking for work and joined those in the Not-in-Labor-Force. A strong and stable middle-class is core to the American dream where rewards come to those who work hard and each generation does better than the previous. Therefore, emphasis needs to be on meaningful employment. The more people we employ means less unemployed.
Conflict Containment. Jobenomics assesses the following probabilities in the strategic area entitled, Conflict Containment: 13% chance that it will continue to muddle along, 50% chance that it will get a little worse, and 38% chance of getting much worse.
Jobenomics forecasts that conflicts will continue unabated with the potential for some to escalate regionally and internationally in 2014. These disruptions could have a deleterious impact on the US and global economies. The question is how much? A nuclear exchange between Israel and Iran could be calamitous enough to cause a shift in the global balance of power.
Conflicts and Extremism. Economic crises often give wing to extremist forces. According to the Economist Intelligence Unit (EIU)[31], a sister unit to the prestigious The Economist newspaper, 80% of the 150 countries studied face very high, high or medium risk of social unrest in 2014. Compared to five years ago, the high- and very-high risk nations have increased 40% from 46 to 65 countries. The EIU believes that “economic distress is almost a necessary condition for serious social or political instability” that can metastasize across the globe. World War I started with the 1914 assassination of the heir to the Austro-Hungarian throne that rapidly led to hostilities between the central powers of Europe. By 1918, 65 million died from combat and disease. World War II started in 1939 with the German invasion of Poland. By 1945, 100 million fatalities occurred across four continents. Many believe that World War III commenced on 9/11, ushering in an age of Third World and sub-nation state extremism empowered by global communications, and weapons of mass disruption and destruction.
Global Islamification Movement. From a Jobenomics perspective, economic forecasters do not factor in the possibility of Islamist/Salafi/Jihadi extremists disrupting the global financial community in 2014.
The global Islamification movement’s goal of a Sharia-controlled world spans the world from North Africa, the Levant, Middle East, Southeast and Central Asia, to East Asia. As a means of comparison, WWI and WWII involved approximately 100 million people, whereas the conflicts regarding global Islamification involve over 1.5 billion people. These conflicts have largely been local and regional, focused on the worldwide Islamic community (Ummah) with a limited number of direct attacks, like 9/11, on the West. Other than oil spikes, the global financial community has avoided major disruptions by local and regional conflicts associated with the global Islamification movement.
However, 2014 could be different. The Arab Spring that once held great promise is now clouded with great uncertainty. The Syrian civil war is evolving into a regional war encompassing the Levant and the Arab Gulf. Iran is now a “nuclear threshold” country with infrastructure, fissile material and expertise to quickly build a nuclear weapon. The ever-evolving al Qaeda and associated groups of terrorists are upping their game with cyber and other low-cost weapons of mass destruction or disruption. All of these threats are hard to define empirically in terms of macroeconomics. However, one must conclude that the economic impact of a major disruption, or series of minor disruptions, could be severe.
Pivot to Asia. Jobenomics believes that China presents more of an opportunity than a threat to the US. Unfortunately, the pivot to Asia has emphasized threat over opportunity. The Obama Administration’s “pivot” to Asia was originally conceived as a political and economic strategy to focus on the fastest growing region of the world. Unfortunately, the implementation of this strategy has caused great uncertainty and anxiety with China and key US regional allies, with military hedging taking the forefront.
The US is fortifying US bases from Australia to Guam to Japan. In response, China has upped the military ante with a plethora of military spending, cyber warfare and military posturing. In November 2013, Chinese President Xi launched the “Chinese Dream” campaign that includes “a dream of a strong nation and a strong army.” Also in November, China unilaterally established a new Air Defense Identification Zone (ADIZ) in the East China Sea that challenges Japanese, South Korean and Taiwanese economic and security interests. The US challenged the ADIZ with two unarmed B-52 bombers as a show of force. China responded with fighter aircraft patrols and the deployment of their new aircraft carrier, the Liaoning. To monitor the Liaoning, the US Navy deployed a number of ships. During the monitoring operation, one US guided missile cruiser, the Cowpens, almost collided with a Chinese naval ship, causing a serious diplomatic incident that was not reported to the general public until a week later. Defense Secretary Chuck Hagel calls the Chinese Navy “irresponsible” in escalating tensions with the United States. According to Secretary of State John Kerry, the ADIZ is significantly increasing risk of a “dangerous miscalculation or an accident.” In China, Mr. Xi’s “Chinese Dream” has swept the country, stirring a nationalist fervor not seen in decades. This fervor is likely to escalate to greater provocations with the US and other Asian countries in 2014.
Asian nations are also upping the ante in response to China’s increased military spending that has hit $172 billion last year, up 64% since 2008. Japan, South Korea, India, Indonesia, Philippines, Vietnam and Taiwan have collectively increased their military spending from $116 billion in 2008 to $145 billion last year—an increase of 25%. In January 2014, Japan will release its new 10-year defense policy that is reportedly much more expeditionary and aggressive. The draft document cites China’s rapid build-up, North Korea’s nuclear and missile programs, and Russia’s military modernization as prime concerns for Japan. Japan’s Prime Minister Shinzo Abe will be traveling to other Asian nations to forge alliances in the region and to encourage military modernization —primarily in response to the growing Chinese threat.
Barring any “dangerous miscalculation or an accident,” 2014 will likely be the year of continued diplomatic and military posturing between the US and China that will cause global economic tension that, in turn, will limit global growth potential. America’s pivot to Asia will focus on shoring up relationships with the 11 Trans-Pacific Partnership nations. China will focus on building their middle-class to reduce dependence on foreign consumption, as well as amplify its “de-Americanized world” and “new world reserve currency” global initiatives.
In 2014, Jobenomics predicts that military and economic tensions between the US and China are likely to increase, forcing major Asian trading partners to choose between two economic superpowers. Military rhetoric is likely to increase on both sides with nationalist Chinese arguing for increased anti-access systems and the Pentagon advancing the notion of the Chinese becoming a near-peer threat. For the most part, most of this military rhetoric will be bluster. In the near-term, China is inextricably linked to the US economically and militarily. China’s economic miracle is largely due to manufacturing prowess. The US is not only the largest consumer of these manufactured goods, but it has economic and military hegemony with most of the developed nations of the world. Some argue that the Chinese could dump the $1.3 trillion of US Treasury bonds, signaling Chinese influence over the US financial system. This too is largely bluster since the China manufacturing miracle is also their greatest Achilles’ heel. Any major economic assault on the US would likely cause a global recession, thereby inflicting great damage on Chinese exports, trade and credibility.
Black Swans. A black swan is an event that comes as a surprise and has a major impact that is recognized mainly after the fact, such as the 2008 sub-prime mortgage crisis that nearly brought the US financial system to the brink of collapse. There are a number of known and unknown-unknown crises and Black Swan events that could propel the US economy into a prolonged period of decline. Unknown-unknowns (unk-unks) have been a part of the US military wargaming community since the early 1980s. Unk-unks acknowledge possibilities that are not conceived at a given point in time. The 9/11 Trade Tower attack was an unk-unk. The Eyjafjallajökull Icelandic volcano was an unk-unk that cost the airline industry three years of profits. The BP oil spill is another unk-unk. The response guide for unk-unks cannot be written, but only nervously anticipated. It is not unusual for lives of individuals, as well as the future of nations, to pivot on an unanticipated or unintended event.
Black Swans can be a blessing as well as a curse. World War II destroyed the economies of Europe and Asia, leaving the US and Argentina as the two largest industrial powers. The US economy boomed during the three decades after WWII. Argentina’s economy collapsed as the country turned inward favoring state control, large state-controlled enterprises, public sector interventionism and protectionism, and higher rates of public spending. By the mid-1970s, Argentina’s industrial output and per capita income experienced a precipitous decline with inflation rates averaging 300% per year until the 1990s. What happened to Argentina could happen to the US. In the last three decades, the US has moved from the largest creditor nation in the world to the world’s largest debtor nation. A few Black Swans could bring about an economic decline similar to the one experienced by the Argentines.
While recessions are not truly Black Swan events, no one knows when the next one will hit. On average, the US economy faces four economic crises and two recessions per decade. So far this decade, we have been lucky. Or, have we just powered our way through these four years with excessive stimuli and wishful thinking? Year 2014 will likely tell the tale. Jobenomics asserts in this report that many of the commonly used macroeconomic indicators do not present the whole story.
Consequently, this Jobenomics 2014 Economic Forecast attempts to balance strategic issues with macroeconomic indicators, with special attention on potential disruptive factors, technologies and events. Analyzing macroeconomic indices and rates within a strategic geo-economic/political/ military/social-religious context allows economic, political, corporate, and media forecasters to envision multiple outcomes in addition to those based on the existing state of affairs.
[1] Congressional Budget Office, The Budget and Economic Outlook: Fiscal Years 2013 to 2023, The Economic Outlook for 2014 to 2018, 5 Feb 2013, http://www.cbo.gov/publication/43907
[2] US Small Business Administration, Office of Advocacy, http://www.sba.gov/sites/default/files/FAQ_Sept_2012.pdf
[3] Thomson Reuters/PayNet Small Business Lending Index, retrieved 23 Dec 2013, http://paynetonline.com/SmallBusinessInsights/ThomsonReutersPayNetSmallBusinessLendingInde.aspx
[4] Thomson Reuters/PayNet Small Business Delinquency Index, retrieved 23 Dec 2013, http://paynetonline.com/SmallBusinessInsights/ThomsonReutersPayNetSmallBusinessDelinquency.aspx
[5] US Energy Information Administration, November 2013, Monthly Energy Review, http://www.eia.gov/mer
[6] US Energy Information Administration, 16 December 2013, Annual Energy Outlook 2014-Early Release Overview, http://www.eia.gov/forecasts/aeo/er/pdf/0383er(2014).pdf
[7] Ibid, Table 1.3 Primary Energy Consumption by Source
[8] US Department of Energy, Energy Efficiency & Renewable Energy, Reduce Oil Dependence Costs, http://www.fueleconomy.gov/feg/oildep.shtml
[9] The World Bank, Market capitalization of listed companies (current US$), http://data.worldbank.org/indicator/CM.MKT.LCAP.CD
[10] NASDAQ Dubai, Why list with us?, http://www.nasdaqdubai.com/listing/why-list-with-us
[11] Federal Reserve, Economic Projections of Federal Reserve Governors and Reserve Bank Presidents, Change In Real GDP, Central Tendency, Inflation Adjusted Percentages, Table 1 Years 2009 through 2013, http://www.federalreserve.gov/monetarypolicy/fomccalendars.htm#2868
[12] US Bureau of Economic Analysis, Table 1.1.11, Real Gross Domestic Product: Percent Change From Quarter One Year Ago, http://www.bea.gov/iTable/iTable.cfm?ReqID=9&step=1#reqid=9&step=3&isuri=1&903=310
[13] Federal Reserve Bank of Philadelphia, Fourth Quarter 2013 Survey of Professional Forecasters, 25 Nov 2013, https://www.philadelphiafed.org/research-and-data/real-time-center/survey-of-professional-forecasters/2013/survq413.cfm
[14] Ibid.
[15] Federal Reserve, Flow of Funds Accounts of the United States, Table F.6 Distribution of Gross Domestic Product, Page 12, 9 December 2013, http://www.federalreserve.gov/releases/z1/Current/z1.pdf
[16] US Department of Commerce, Bureau of Economic Analysis, Table 2.3.5U Personal Consumption Expenditures by Major Type of Product and by Major Function, 23 December 2013, http://www.bea.gov/itable/iTable.cfm?ReqID=12&step=1#reqid=12&step=3&isuri=1&1203=14
[17] US Department of Commerce, Bureau of Economic Analysis, Table 2.5.5 Personal Consumption Expenditures by Function, 7 August 2013, http://www.bea.gov/iTable/iTable.cfm?reqid=9&step=3&isuri=1&903=69#reqid=9&step=3&isuri=1&910=X&911=0&903=74&904=2004&905=1000&906=Q
[18] American Bankruptcy Institute, Annual Business and Non-business Filings by Year (1980-2012), Year 2012, http://www.abiworld.org/AM/AMTemplate.cfm?Section=Home&CONTENTID=66471&TEMPLATE=/CM/ContentDisplay.cfm
[19] Research America, Zogby Analytics Poll, November 2013, http://www.researchamerica.org/uploads/Nov13nationalpollwithASH.pdf
[20] The New York Times, The Opinion Pages, Look How Far We’ve Come Apart, by Jonathan Haidt and Marc J. Hetherington, http://campaignstops.blogs.nytimes.com/2012/09/17/look-how-far-weve-come-apart/, 17 Sep 2012
[21] Ideology & Congress, by Keith T. Poole and Howard Rosenthal; Second, revised edition of Congress: A Political Economic History of Roll Call Voting.
[22] Thomas M. Davis III, Washington Today (Presentation), 20 November 2013.
[23] GovTrack.us, Ideology Analysis of Members of Congress, https://www.govtrack.us/about/analysis#ideology
[24] Beyond Ideology: Politics, Principles, and Partisanship in the U. S. Senate, France E. Lee, 2009
[25] The White House, President Barak Obama, Office of Management and Budget, The Budget, Fiscal Year 2014 and Historical Tables (S-1, S-4), http://www.whitehouse.gov/sites/default/files/omb/budget/fy2014/assets/tables.pdf
[26] BLS, Labor Force Participation Rate, http://data.bls.gov/timeseries/LNS11300000
[27] BLS, http://data.bls.gov/timeseries/LNS12300000
[28] Cornell University, US2010 Study, Residential Segregation by Income, 1970-2009, Kendra Bischoff & Sean F. Reardon, 16 Oct 2013, http://www.s4.brown.edu/us2010/Projects/Reports.htm
[29] US Census Bureau, Historical Data, Median Household Income 2012, Table H-8, 2012 Dollars, http://www.census.gov/hhes/www/income/data/historical/household/
[30] BLS, Job Openings ad Labor Survey (November 2013), http://www.bls.gov/news.release/jolts.htm
[31] The Economist, The World in 2014, Risk of Social Unrest in 2014, page 80