
Jobenomics tracks both unemployment (see: Unemployment Scoreboard: September 2013) and employment reports (this posting).
Executive Summary. According the 7 September 2013 US Department of Labor’s Bureau of Labor Statistics (BLS) Employment Situation Summary[1], total nonfarm payroll employment increased by 169,000 in August 2013. However, the change in total nonfarm payroll employment for June 2013 was revised downward from 188,000 to 172,000, and the change for July 2013 was revised downward from 162,000 to 104,000. Consequently, the 148,000 average over the last three months is well below the 250,000 monthly jobs needed for a sustained recovery.
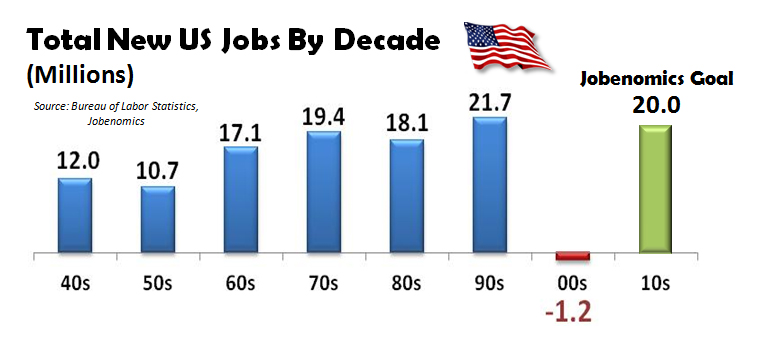
For six decades, the US consistently produced tens of millions new jobs per decade. Then the bottom fell out in the decade of the ‘00s with a loss of 1.2 million jobs. It is critical that significant numbers of jobs are created this decade (’10s) for the US economy to recover. 20 million new jobs by year 2020 is a reasonable goal. Not only has 20 million been historically achieved, but is the number needed to accommodate 16 million new labor force entrants per decade and to reduce 4 million unemployed in order to achieve the so-called full employment rate of 5%. Based on this goal, the US should have produced 11 million jobs by 1 September 2013. We have only produced 6.8 million, which represents a 39% shortfall of the jobs needed.
The US private sector created 7,409,000 jobs this decade (‘10s), whereas the public sector lost 649,000 jobs. In the private sector, service-providing industries employ 83.7% of all Americans whereas the goods-producing industries employ only 16%. 83.9% of all new jobs this decade were produced by four service-providing industries: professional and business services; trade, transportation, utilities; education and health services; and leisure and hospitality. Regardless of government rhetoric, the much touted goods-producing manufacturing and construction industries are not likely to create a significant amount of jobs in the foreseeable future. Small, emerging and self-employed business creation is essential for jobs creation and a healthy economic future. Small business employs 77% of all Americans and has produced 72% of all new jobs this decade. Unfortunately, the vast majority of government stimulus funds have been directed at financial institutions and large corporations with little for small business—the engine of the US economy.
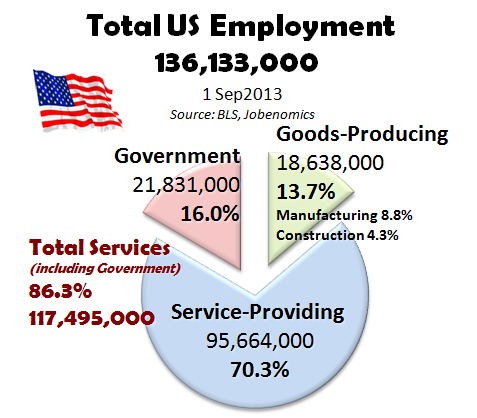
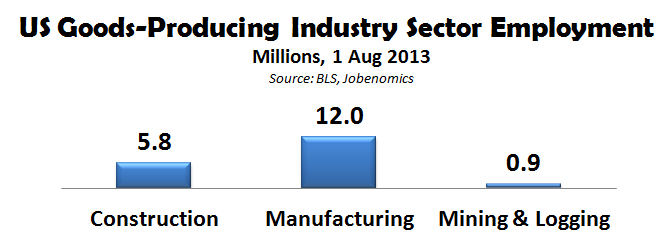
US Employment. Today, 136,133,000 Americans are employed in government and the private sector. 95,664,000 (70.3%) work in private sector service-providing industries. Service industries include professional services, education and health, financial, trade, retail, transport, distribution, and information-dominated businesses. 18,638,000 (13.7%) are in private sector goods-producing industries that include manufacturing (8.8%) and construction (4.3%). 21,831,000 (16.0%) Americans work for government at the federal, state and local levels. Since government employment is services-related, a total of 86.3% of all Americans work in service-related industries.
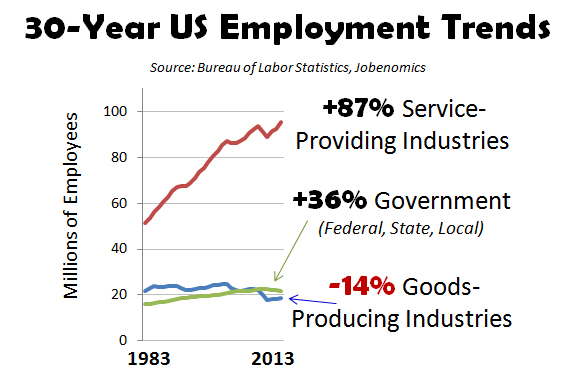
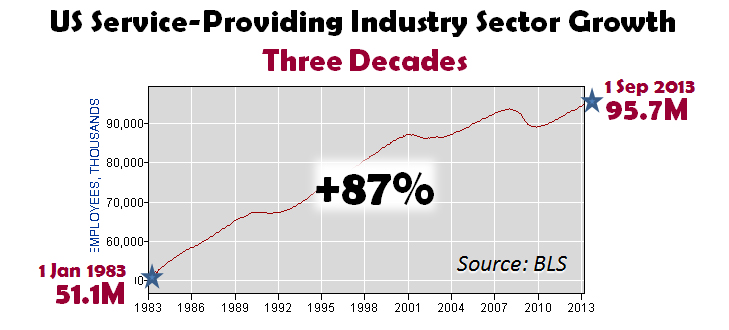
The 30-year trend in US employment has overwhelmingly been in the service-providing industries with a 30-year growth rate of 87%. Not surprisingly, government has also grown significantly at a rate of 36%. However, as discussed in this posting, government employment has decreased in the last several years and is likely to continue to do so. Finally, US goods-producing industries have declined 14% during the last thirty years. As discussed in this report and in previous manufacturing and construction industry specific postings, Jobenomics predicts that the major goods-producing industries of manufacturing and construction are not likely to produce a significant amount of jobs in the foreseeable future.
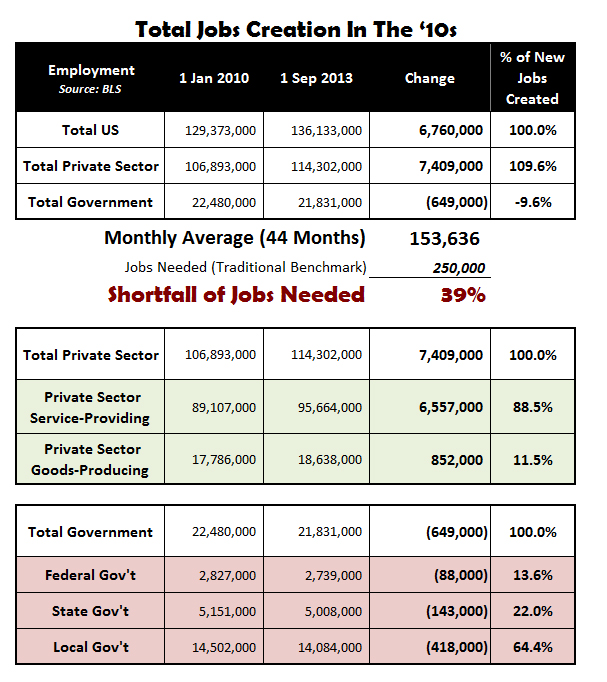
While the US has enjoyed some employment growth since the beginning of this decade, America is only producing 61% (39% shortfall) as many jobs as needed. The US produced only 6,760,000 jobs compared to the 11,000,000 jobs needed as measured against the traditional benchmark of 250,000 jobs per month (250,000 x 44 months = 11.0 million). Of the three employment sectors reported by the Bureau of Labor Statistics, the private sector’s service-providing industries created 6,557,000 jobs, the private sector’s goods-producing industries created 852,000 jobs, and the government sector lost 649,000 jobs—with 64.4% (418,000) of all government jobs lost at the local level.
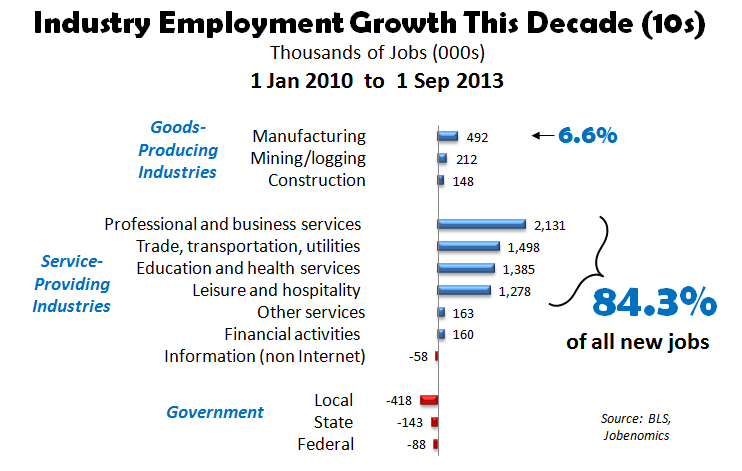
84.3% of all new jobs this decade were produced by four industries (professional and business services; trade, transportation, utilities; education and health services; and leisure and hospitality) in the service providing sector. Much touted manufacturing only contributed 6.6% of the US employment growth. The non-internet information industries and government lost jobs this decade.
Private sector businesses by company size. The following charts examine private sector businesses by size. As reported by the ADP National Employment Report (published monthly by the ADP Research Institute in close collaboration with Moody’s Analytics), data indicates that small business is the dominant economic force in terms of employment and job creation.
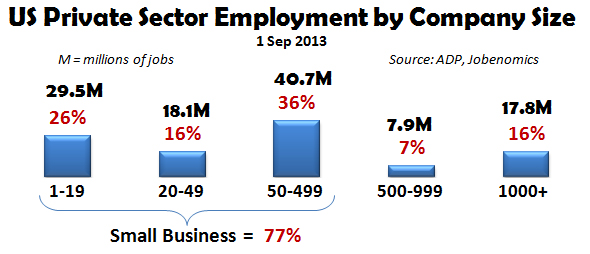
Today, small businesses (those companies with less than 500 employees as defined by the US Small Business Association) employ 77% of all private sector Americans with a total of 88.2 million employees—5 times the amount of large corporations (1000+). Very small businesses with less than 19 employees employ 66% more than all large corporations combined (29.5M versus 17.8M).
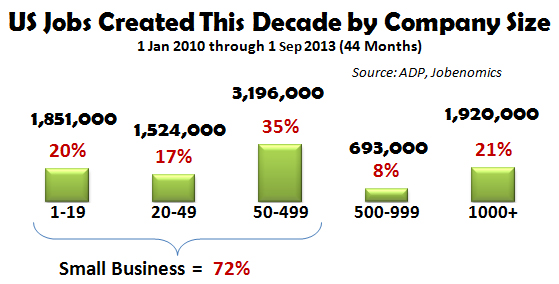
Since the beginning of this decade, small business produced 71% of all new American jobs. This is an amazing statistic considering the adverse lending environment by financial institutions, mounting government regulation, and the pittance of federal government spending on small business creation. Equally important, is the lack of commercial lending to very small and startup businesses that have been starved for capital. Very small and startup businesses have traditionally been the primary source of employment for entry-level workers and the long-term unemployed. Had the US government paid more attention to this category of employers during its generous handouts of $16.6 trillion worth of federal government stimuli, bailouts and buyouts since the Great Recession, Jobenomics estimates that as many as five million more Americans would be employed today.
According the US Small Business Association[2], startups, minus closures, create about 40% of American net new jobs. Also according the SBA, about half of all new businesses survive five years or more, and about one-third of these start-ups survive 10 years or more. Jobenomics is currently working with a dozen US cities to implement Jobenomics Business Generators to create tens of thousands of new startup businesses. The objective a Jobenomics Business Generator is to increase “birth rates” of start-up businesses as well as to extend the “life span” of these businesses.
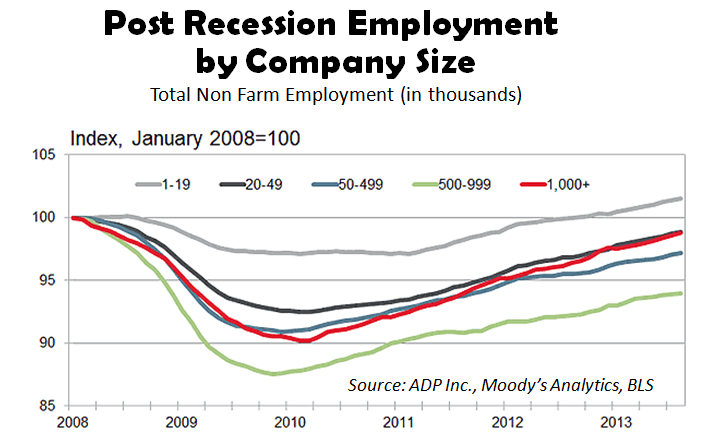
It is a common misperception that small businesses, especially very small (1-19 employees), are the most fragile. The chart (above) indicates that very small businesses have been the most resilient of the five business categories following the Great Recession of 2008. This fact cannot be understated in an environment where small businesses have been starved for investment capital.
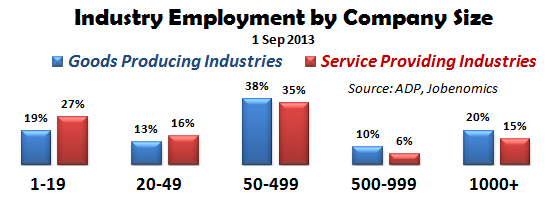
It is also a common misperception that small businesses are only involved service-providing industries whereas large major corporations dominate goods-producing industries. The above chart indicates that small and medium sized businesses play a major role in both goods-producing (manufacturing, construction, and mining) as well as the service-providing industries.
Service-providing sector. The US service-providing sector now employs 95.7M and has grown 87% over the last three decades.
Since year 2010, the US service-providing sector averaged 7% growth with 6,557,000 new jobs created. Today, the US service-providing sector employs a total of 95,664,000 people across the seven industries shown below.
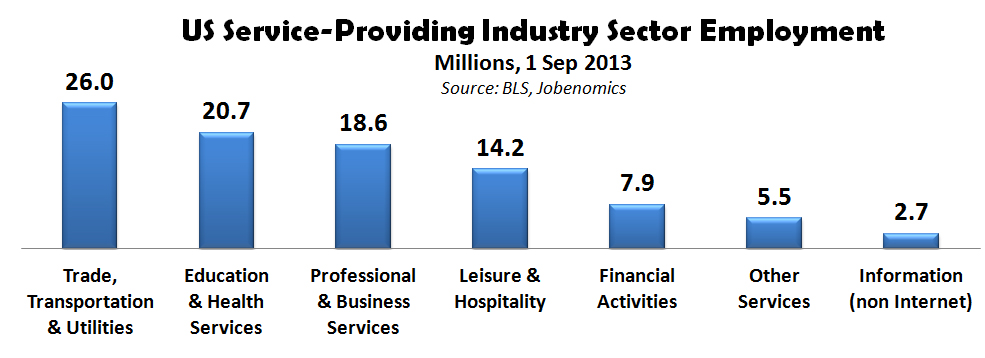
Employment statistics for industries in the service-providing sector are ranked by the number of jobs created between 1 January 2010 and 1 September 2013 (44 months):
- Professional/business services: 2,131,000 new jobs
- Trade, transportation, utilities: 1,498,000 new jobs
- Education and health services: 1,385,000 new jobs
- Leisure and hospitality: 1,278,000 new jobs
- Other services: 163,000 new jobs
- Financial activities: 160,000 new jobs
- Information (non-internet, like publishing): -58,000 jobs lost
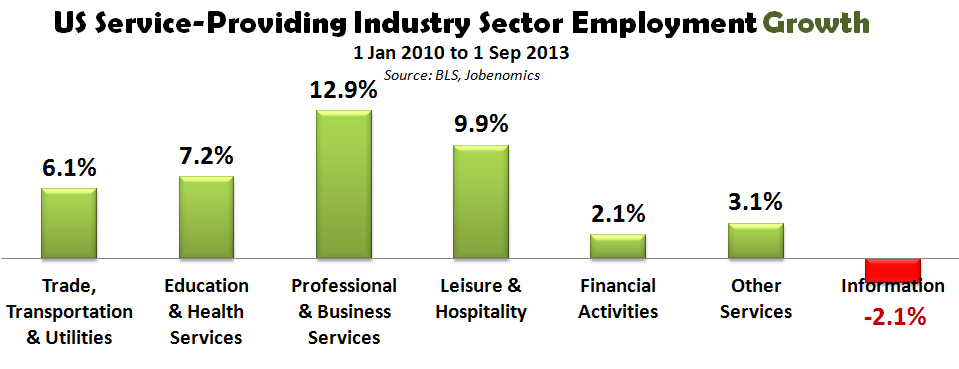
Of the seven service-providing industries, only the Information (non-internet companies like broadcasting and publishing, such as newspapers) industry lost jobs (-2.1%) during the post-Great Recession recovery period starting in January 2010. The top three industries are Professional & Business Services (+12.9%), Leisure & Hospitality (+9.9%) and Education & Health Services (+7.2%).
Goods-producing sector. The US goods-producing sector includes manufacturing, construction and mining/logging industries and has declined 25% since its peak in March 2000.
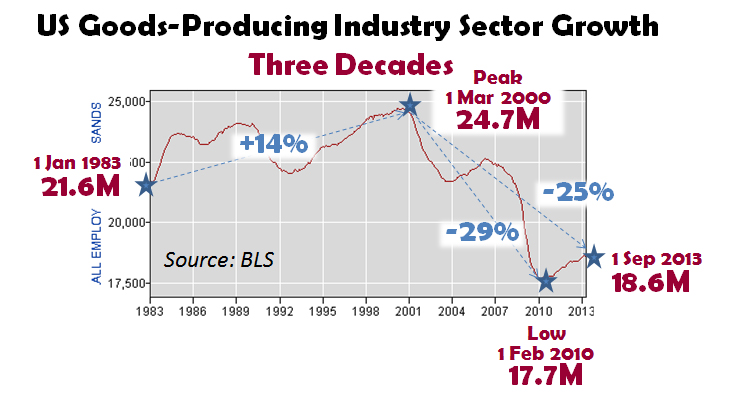
US goods-producing sector has grown by approximately 900,000 since its post-recession low in February 2010, but has a long way to go to reach peak employment. Today, the US service-providing sector employs a total of 18,638,000 people across the three industries shown below.
Employment statistics for industries in this sector are ranked by the number of jobs created between 1 January 2010 and 1 September 2013 (44 months):
- Manufacturing: 492,000 new jobs
- Mining and logging: 212,000 new jobs
- Construction: 148,000 new jobs
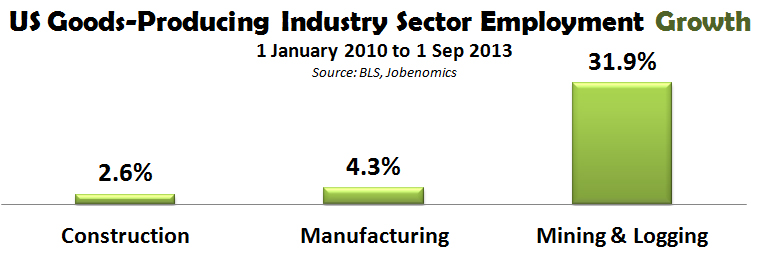
The fastest growing industry in the goods-producing sector is mining & logging, followed by manufacturing and construction. The goods news is that the construction industry is now positively producing jobs for the first time since the Great Recession.
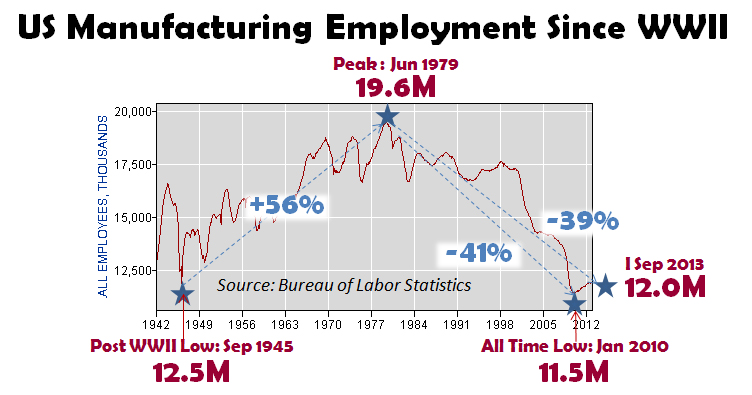
While manufacturing has added about ½ million new jobs since the beginning of this decade, it has a long way to go to achieve peak its peak level of 19.6 million in June 1979 after sustaining a consistent growth rate from its post-World War II low of 12.5 million in September 1945. Since its peak in 1979, the US manufacturing industry has declined by 39%. Today, US manufacturing employs 11,963,000. While the addition of approximately 500,000 new jobs from manufacturing’s all time low of 11.5 million in January 2010 is positive, the manufacturing sector is still in the doldrums.
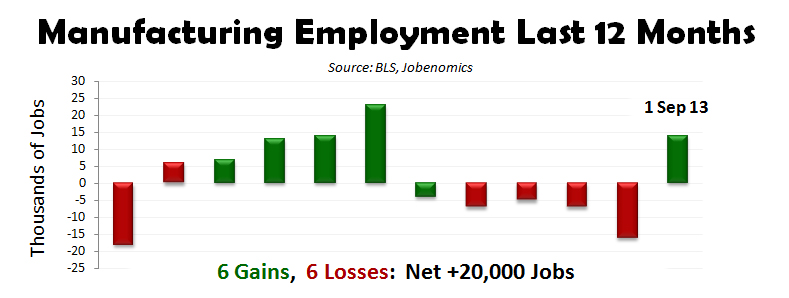
Within the last 12 months, manufacturing has had 6 down-months and 6 up-months in terms of employment with a disappointing net increase of only 18,000 jobs in the last year.
Notwithstanding the political rhetoric about increasing US exports, re-shoring of US manufacturing jobs and increased US productivity, Jobenomics forecasts limited upside jobs potential in manufacturing due to excessive government regulation, improved automation, competitive foreign labor rates and a lack of higher-tech manufacturing skills in our civilian labor force (see Jobenomics’ Manufacturing Industry Forecast posting). The advent of new technologies (like 3D printing of manufactured parts and advanced robotics) reduce the need for non-skilled labor. By some accounts, US manufacturers have 3.5 million open high-tech jobs that currently are unfilled.
Jobenomics is also concerned by the amount political and public emphasis on the manufacturing growth as the primary engine for jobs creation. While manufacturing is vitally important to our nation, political emphasis needs to be on the high growth industries in the service sector. Manufacturing emphasis should be on protecting our gains and focusing on next-generation manufacturing technology, processes and recapitalization.
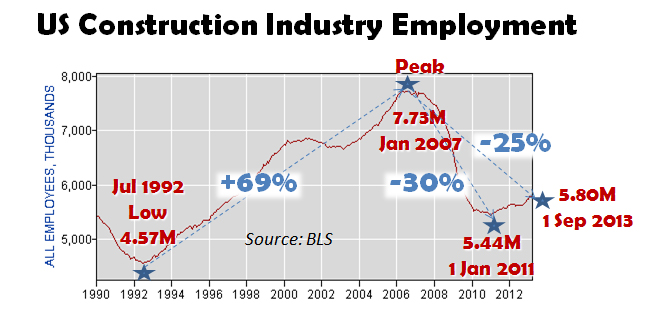
Even though the construction industry is showing signs of growth, the construction sector continues to struggle after a rapid rise (69%) during the go-go years in the 1990s and the housing bubble in the early 2000s. In the 2006-07 time period, peak construction employment was 7.73M. Today, it is 5.80M, a loss of -25%. The good news is that construction employment has stopped its decline and has increased for its post-recession low of 5.44M in January 2011.
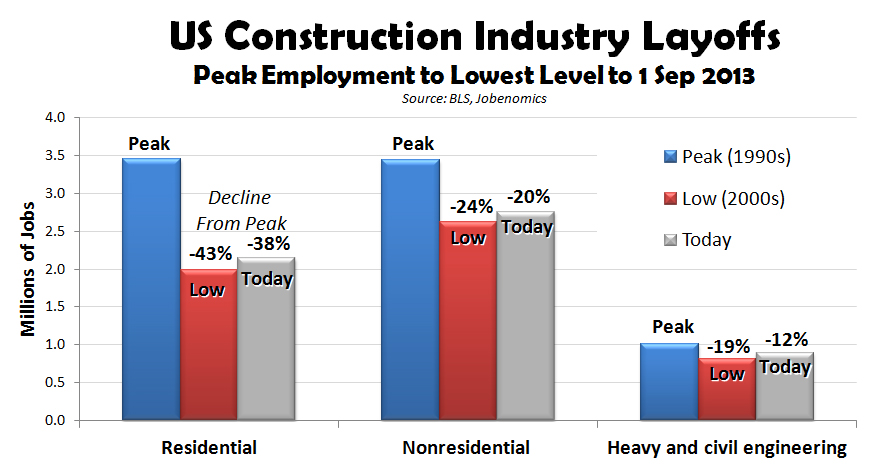
Residential construction employment was hardest hit segment with a 43% decrease from its pre-recession peak (3.45 million) to its post-recession low (1.98 M million). Today, residential construction employment is still down from its peak by 38% with a total employment of 2.14 million. Nonresidential construction fared slightly better with losses of -24% from peak and -19% today with 2.77 million employed. The heavy and civil engineering sector fared the best (largely due to federal stimulus programs) loosing -19% from peak and now down only -11% with a total of 890,000 employed.
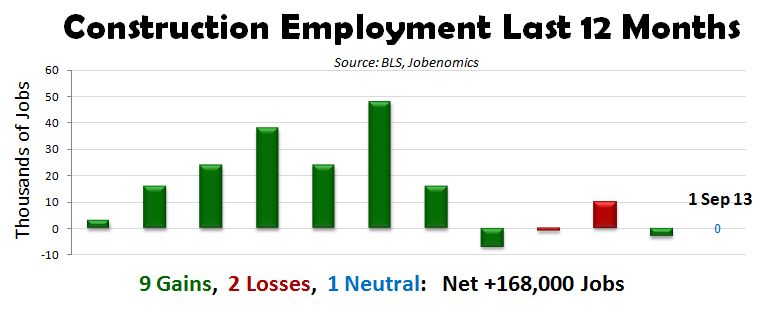
Within the last 12 months, construction has had 9 up-months, 2 down-months and one neutral month in terms of employment with a net increase of 168,000 jobs in the last year. While these number are positive overall, the recent construction industry downturn occurred during peak summer construction months during a period where new home sales have been increasing. With the recent increase in mortgage rates, it will be interesting to see if construction employment will be affected.
Construction usually leads economic recoveries. However, this recovery is different. Jobenomics forecasts that the residential construction industry will not produce a significant number of jobs for the remainder of this decade due to foreclosures, underwater mortgages, unemployment as well as changing attitudes to the value of homeowners. Due to the stagnant economy and government deficits, commercial and heavy construction is also unlikely to produce a significant number of new domestic jobs. Jobenomics does see potential in major foreign construction projects, green construction and renovation of older homes, and reconstruction of disaster areas like the Northeast after Hurricane Sandy that is getting a $65 billion infusion of cash form the federal government. However, these bright spots will not make up for stagnancy in US GDP and US employment.
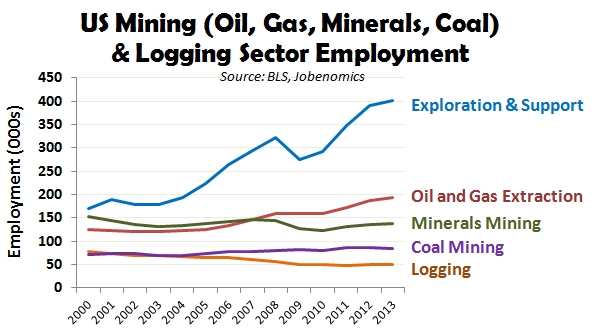
Mining (oil & gas extraction, coal and minerals) and logging goods-producing sector continues to be a bright area for employment growth. From the beginning of this decade, mining increased employment by 212,000 jobs, with an impressive growth rate of 31.9%. With proper private and public sector support, this industry has significant upside potential.
Mining exploration and support employment has more than doubled in the last decade and likely to double again with exploration for domestic energy sources. Oil and gas extraction is also likely to double with new natural gas, oil shale, oil sands and offshore oil resources are exploited via new technology, like horizontal drilling and hydraulic fracking. Minerals mining employment has been stagnant over the decade, but this may change as commodity prices (gold, silver, copper) increase as well as worldwide demand for these commodities increase. Coal mining and logging are not likely to increase anytime soon mainly due to environmental pressure and the emphasis on clean renewable technology (wind and solar).
The Government Employment Sector. Total government sector employment currently is 21,831,000. Since 1 January 2010, government has lost 649,000 jobs, a negative 2.9% growth rate.
Employment statistics in this sector is shown in the following chart and are ranked by the number of jobs lost between 1 January 2010 and 1 September 2013:
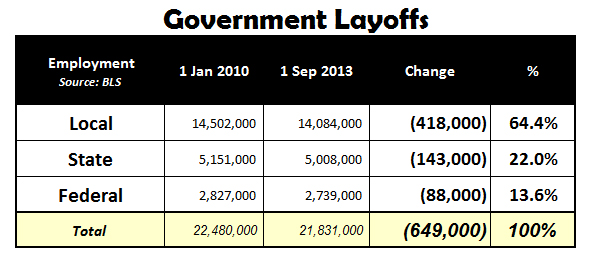
The government sector continued to lose jobs with 64.4% of all job losses occurring with local government (mainly teachers, police and firefighters), 22.0% at the state level, and 13.6% in the federal government (not including military, which is also downsizing). Jobenomics predicts that government job losses will continue to decline due the effects of sequestration as well as debt and deficit spending. In addition, if the US economy suffers an economic disruption due to either domestic or foreign events, government spending will likely decrease further.
In conclusion, business and jobs creation is the number one issue facing US economic recovery. While some would argue that debt/deficits or entitlement/welfare are the biggest issues, it takes businesses to create lasting jobs that generate tax revenue to run government as well as supporting the less fortunate. The following two charts are about as simple as Jobenomics can make it.
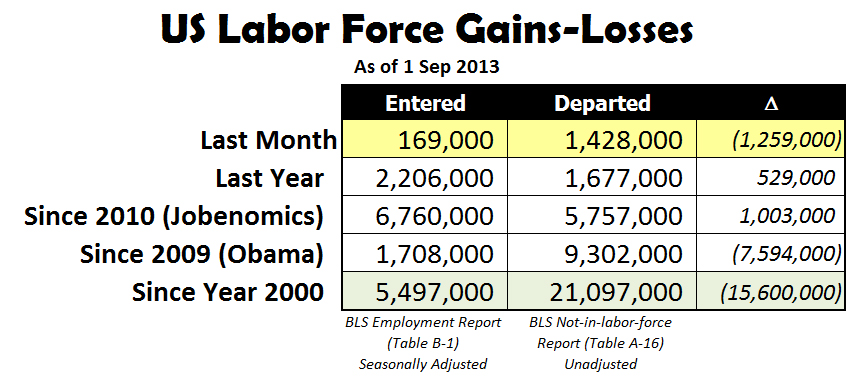
While total nonfarm payroll employment increased by 169,000 in August 2013, and the unemployment rate edged down to 7.3%, the overall employment situation deteriorated significantly with 1,428,000 voluntarily leaving the US labor force. Within the last year, the US has achieved a net gain of 529,000 jobs between those entering and leaving the labor force. Since the beginning of the decade (January 2010), the US had a net gain of 1,003,000 jobs. Since the beginning of the Obama Administration (January 2009), the US had a net loss of 7,594,000 that mainly occurred during the last year of the Great Recession. Since year 2000, almost 4 times as many people departed the US labor force than entered it, with 5,497,000 people entering the US labor force as opposed to 21,097,000 who departed.
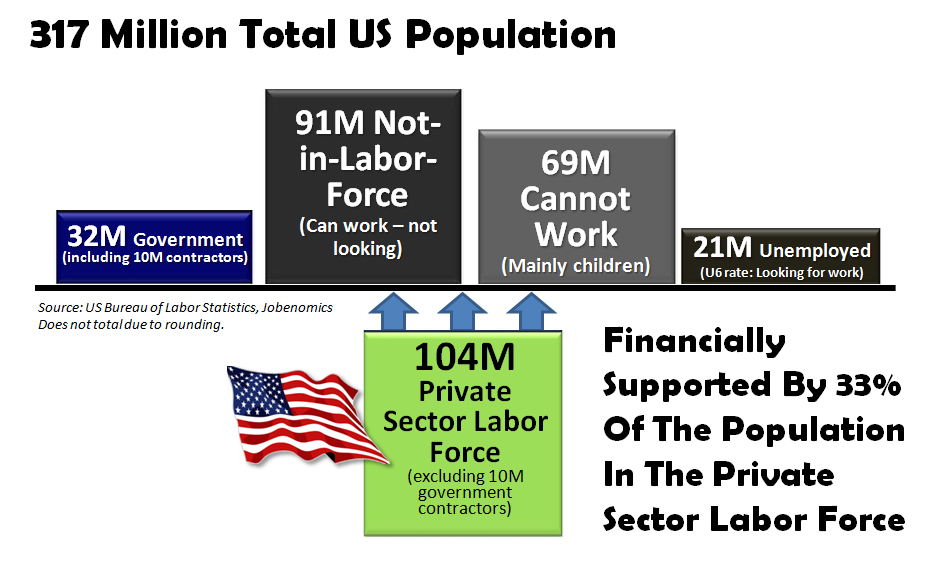
Today, only 33% of all Americans financially support the rest of the country. 104 million workers in the private sector support 32 million that work for government (including contractors), 91 million that can work but choose not to work, 69 million that cannot work and 21 million that are looking for work (officially unemployed and unemployed). America’s number one priority is to grow the base with emphasis on small business creation, which produced the majority of all new jobs this decade.
[1] US Bureau of Labor Statistics’ Employment Situation Summary, http://www.bls.gov/news.release/empsit.nr0.htm
[2] US Small Business Association, Office of Advocacy, Which businesses create more jobs—startups or existing businesses?, http://www.sba.gov/sites/default/files/FAQ_Sept_2012.pdf