
Download PDF Version: Minority-Owned Businesses - 10 Jan 2014
Minority-Owned Businesses
www.Jobenomics.com
By: Chuck Vollmer
10 January 2014
Executive Summary. Today, there are 6 million minority-owned businesses in the US. Jobenomics advocates a national goal of 18 million by year 2020—a goal that is achievable and necessary. Race and ethnicity are important elements of America’s economic equation. Jobenomics forecasts that income opportunity (see Income Inequality versus Opportunity posting) will become a leading domestic issue as minorities assert their growing demographic, economic and political power. Racial and ethnic minorities currently constitute 40.8% of the US population, and are responsible for approximately $3 trillion worth of America’s expenditures and consumption for goods and services (see Consumption-Based Economy posting). This degree of economic power could fuel the creation of millions of minority-owned businesses that would provide income opportunity for millions of Americans.
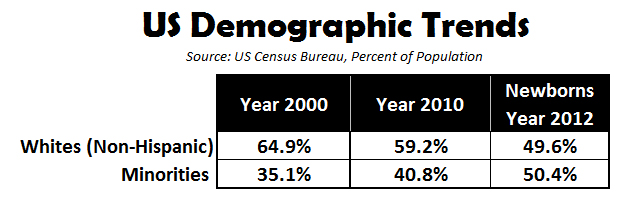
US Minority Demographic Trends. Today, minorities comprise about 41% of the US population, but will be in the majority much sooner than most people recognize. According to the US Census Bureau[1], for the first time in American history, most (50.4%) American children younger than age 1 are now racial and ethnic minorities. Consequently, America could be a generation away from being a minority-majority nation—perhaps quicker, considering aging baby-boomers and low birth rates in the White-majority. California (60.3% minorities), Texas (55.2%), New Mexico (59.8%) and Hawaii (77.1%) are already minority-majority states.
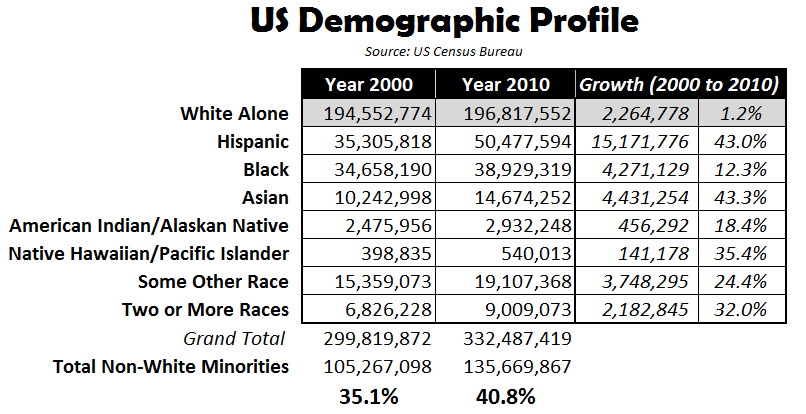
According to 2010 Census data[2], the largest minority group is Hispanics and Latinos (Hispanic) with 50.5 million people, followed by African-Americans (Black) with 38.9 million, Asian-Americans (Asian) with 14.7 million, American and Alaskan Natives with 2.9 million, Native Hawaiian and Other Pacific Islanders with 0.5 million, and “Some Other Race” with 19.1 million. An additional 9 million Americans identified themselves as multi-racial from two or more races. 196.8 million Americans identified themselves as non-Hispanic Whites (White)—a 59.2% majority compared to a minority population of 40.8%.
Between 2000 and 2010, the White population grew by 2.3 million or 1.2%. Asians and Hispanics were the fastest-growing groups by percentage, or 43.3% and 43.0% respectively. The Hispanic population increased by 15.2 million between 2000 and 2010, accounting for half of total US population growth. Blacks grew at a rate of 12.3% for a total gain of 4.3 million over the decade. Asians added 4.4 million during this period. All other minority groups grew by 6.5 million at a combined rate of 26%.
Minorities in the US Labor Force. The US Department of Labor’s Bureau of Labor Statistics (BLS) recently completed a landmark study[3] regarding US labor force characteristics by race and ethnicity[4]. The three major minority groups that the BLS studied were Black, Hispanic and Asian. The following charts were created by Jobenomics using data from the BLS study to compare these major US minority groups’ employment and income characteristics to those of Whites. While important, smaller minority groups (American Indian, Alaskan Native, Native Hawaiian, Other Pacific Islanders, and people who identified themselves as multi-racial or from some other race) are not included in this analysis due to limited numbers (only 2.5% of the US labor force).
The US Civilian Labor Force includes all working-age persons who are employed or unemployed and looking for a job. In 2011, the US civilian labor force was 153.6 million out of a total population of approximately 309 million. Whites dominated the US labor force with 67% (103.3 million workers) of all workers, followed by Hispanics with 15% (22.9 million), Blacks with 11% (17.1 million) and Asians with 3% (4.7 million).
As shown in the following series of charts, employment in the five major occupational categories is more equally distributed between races/ethnicities than the 67% manpower advantage would imply.
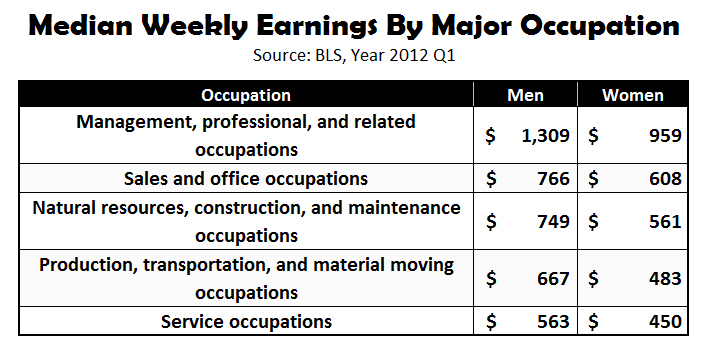
As shown above, the five major occupational categories range from management on top, to service on the bottom in terms of median weekly earnings[5]. Based on these five categories, the three major minority groups fared reasonably well against the White majority as indicated in the following charts.
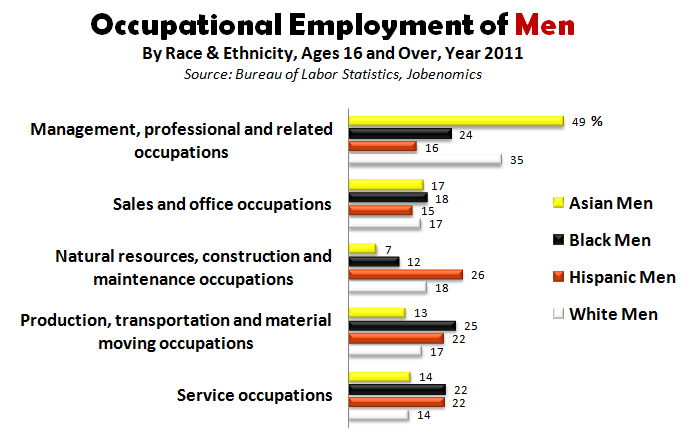
As a percentage of their group, Asian men (49%) were the most likely to be employed in the top category of “management, professional and related occupations” compared to Whites (35%), Blacks (24%) and Hispanics (16%). In “sales and office occupations” all four groups were relatively equally represented (17%, 18%, 15% and 17%). “Natural resources, construction and maintenance occupations” were dominated by Hispanics and Whites. “Production, transportation and material moving occupations” as well as “service occupations” were led by Blacks and Hispanics over Whites and Asians by 22% versus 14% of their respective work forces.
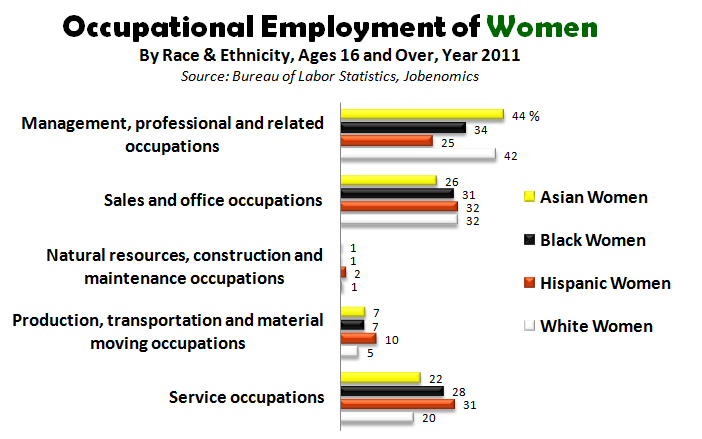
As a percentage of their group, Asian women (44%) were the most likely to be employed in the top category of “management, professional and related occupations” compared to Whites (42%), Blacks (34%) and Hispanics (25%). In “sales and office occupations” all four groups were relatively equally represented (26%, 31%, 32% and 32%). Women were not a major contributor by employment in the “Natural resources, construction and maintenance occupations” category. “Production, transportation and material moving occupations” were relatively equal amongst all women subgroups with Hispanic women having a slight edge. “Service occupations” were relatively close amongst all women subgroups with Hispanics (31%) followed by Blacks (28%), Asians (22%) and Whites (20%).
It is important to note that these two Occupation Employment charts are calculated as a percentage of their group, as opposed to a percentage of total employed, which, as discussed earlier, is dominated (67%) by Whites. For example, Asian-male participation in the “management, professional and related occupations” category is better represented by 49% (percentage of their group) than 5.4% (percentage of the total employed) as reported by other BLS surveys[6]. 49% reflects that almost half of all working Asian-males are involved in management and professional occupations—an impressive percentage. 5.4% indicates only a small number of Asians are in management and professional occupations compared to the total working population—an unimpressive percentage—that does not account for the fact that the total number of Asians only represents 1/20th of the US work force. Consequently, major minority groups are faring much better regarding labor force participation than the media and political activists often portray by using percentage of total employed statistics.
Income and Unemployment Inequities. While Jobenomics asserts that minority groups fare much better in the US labor force than generally perceived, Jobenomics also acknowledges that there are inequities that need to be fixed, especially in the Hispanic and Black subgroups.
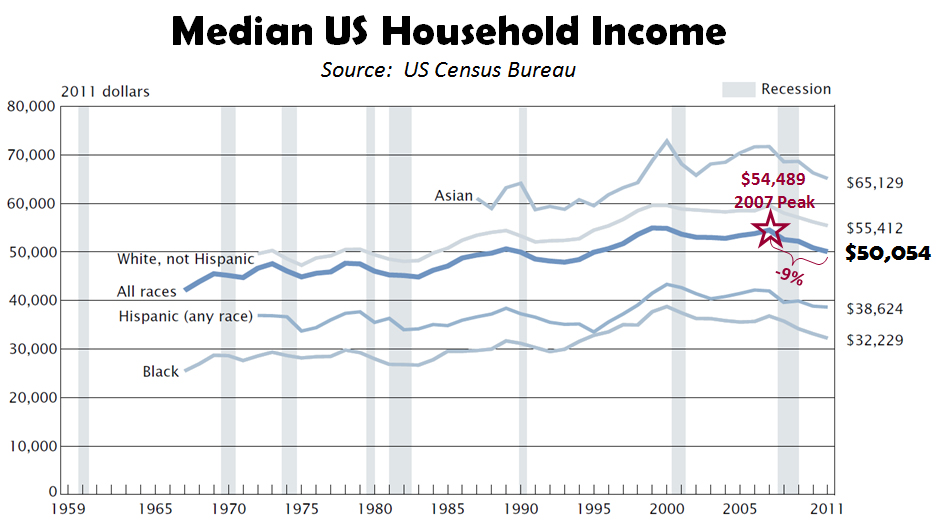
According to the most recent US Census Bureau report[7], US median household income has fallen by 9% since 2007, hurting all Americans regardless of race or ethnicity. Today, the US Asian community maintains the highest median household income of $65,129, followed by Whites ($55,412), Hispanics ($38,624) and Blacks ($32,229).
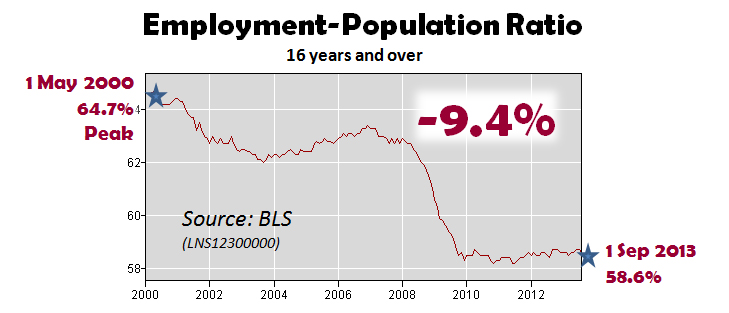
Over the decades, income inequality has remained relatively the same between the races, collectively increasing during good times, and collectively decreasing over bad times. During the good times, income inequality was not a politically-charged issue since increasing household income provided a sense of well-being. Since year 2000, the US Employment-Population Ratio has decreased 9.4% with the greatest impact on the middle-class. During the last six years, the precipitous decline in household income significantly impacted the Black and Hispanic communities that were especially hard-hit during the Great Recession, largely due to the mortgage crisis and the erosion of middle-class jobs. As shown above, over the last three years, the Employment-Population Ratio has flatlined, causing considerable anxiety and discord regarding limited income opportunity.
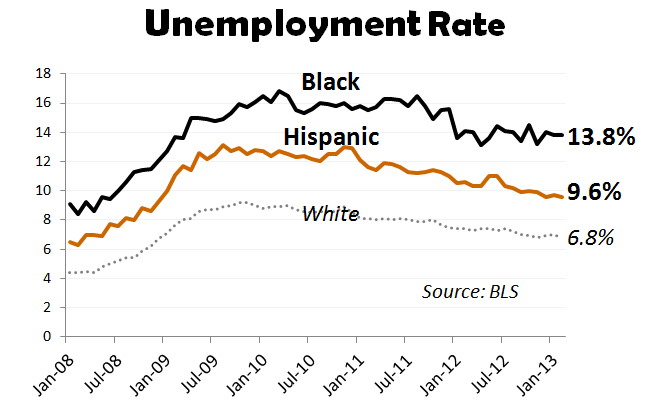
Since the Great Recession, unemployment increased for all Americans, but the Black and Hispanic groups were hit the worst, with current unemployment rates[8] at 13.8% for Blacks and 9.6% for Hispanics, compared to 6.8% for Whites and 5.1% for Asians (not shown on chart due to limited historical data).
Youth unemployment is even more egregious, especially for Black youths aged 16 to 19 years old, which is 38.2% compared to 20.5% for Whites[9].
In summary, Jobenomics concludes that, institutionally, minority groups are not having a major issue with participation. The Asian minority group is doing quite well exceeding White participation in top paying occupations. While Black and Hispanic groups lag behind Whites in participation, they are not lagging by a great extent. On the other hand, Blacks and Hispanics are challenged by their concentration in lower labor categories, high unemployment rates and depressed household incomes.
Minority-Owned Businesses. From a Jobenomics perspective, the primary solution to enhancing minority labor force participation and increasing wealth in minority communities involves minority-owned business creation, which is growing at twice the rate of all US business. If America exploits this trend, millions of minority-owned businesses could be created providing many millions of jobs.
U.S. Census Bureau performs a Survey of Business Owners twice each decade. A survey was conducted in 2007 and the results released in 2011—the latest data available. A survey was conducted in 2012, but the results will not be released until 2015.
Highlights of the 2007 Survey of Business Owners [10] include:
- In 2007, more than one-fifth (21.3%) of the nation’s 27.1 million firms were minority-owned.
- In 2007, minority-owned firms numbered 5.8 million, up from 4.0 million in 2002, an increase of 45.5%—more than double the 17.9% increase for all US businesses. Receipts of minority-owned firms increased 55.0% to $1.0 trillion over the five-year period, compared with the 32.9% increase for all businesses nationwide.
- Of the 5.8 million minority-owned firms, 766,533 had paid employees, an increase of 21.7% from 2002. These firms employed 5.8 million people, a 24.4% increase from 2002, and their payrolls totaled $164.1 billion, an increase of 42.2%. Receipts of minority-owned employer firms totaled $860.5 billion, an increase of 54.3% from 2002.
- In 2007, minority firms with no paid employees (mainly self-employed businesses and partners of unincorporated businesses) numbered 5.0 million, an increase of 50.0% from 2002. These firms had receipts totaling $164.3 billion, an increase of 58.9%.
- Black-owned businesses grew to 1.9 million firms in 2007, up 61% from 2002 - the largest increase among all minority-owned companies; and generated $135.6 billion in gross receipts, up 53% from 2002. Black-owned firms accounted for 7.1% of all US businesses and employed 921,032 persons.
- The number of Hispanic-owned businesses totaled 2.3 million (8.3% of all US businesses) in 2007, up 44% from 2002. Receipts for Hispanic firms increased 55% to $343.3 billion.
- Asian-owned firms grew 41% from 2002 to 1.6 million. Asian-owned firms continue to generate the highest annual gross receipts at $510.1 billion in 2007, increasing 56% from 2002.
Jobenomics believes that doubling or tripling minority-owned businesses from 5.8 million to 11.6 million or 17.4 million is very achievable within a decade—if American communities implement viable plans that emphasize highly-scalable small, emerging and self-employed business creation.
Jobenomics Minority-Owned Business Creation Initiatives. Over the last two years, Jobenomics met with minority leaders in dozens of cities to discuss minority-owned business, wealth creation and meaningful jobs creation. These cities include Harlem (NY), Washington DC, Atlanta, Detroit, Chicago, Phoenix, Fort Worth, Philadelphia, San Diego, Las Vegas, Honolulu, Greensboro (NC), Wilmington (DE), Roanoke (VA), Chester (PA) and Bridgeport (CT). What we learned was encouraging—even in the most financially depressed inner-cities.
It was encouraging to find a high degree of entrepreneurial spirit and willingness to create minority-owned business. However, most government and community leaders have relatively little business experience, especially with start-ups and self-employed businesses. To compensate for inexperience, they tend to look to Washington or big-business that has not produced any net new jobs in the last several decades. Jobenomics contends that the most reliable source of guidance resides in innovators and serial-entrepreneurs. Various governmental small business agencies and associations do an adequate job of counseling and providing grants, but have little expertise in mass-producing highly-scalable small businesses.
The Father of American Education, Horace Mann, stated that “education is the great equalizer of the conditions of men, the balance-wheel of social machinery.” While Jobenomics agrees, the educational paradigm in yesteryear was much different than today. The old paradigm, “get an education to get a job…get a better education to get a better job” simply does not work in today’s high-tech, slow-growth economy where middle-class jobs are increasingly outsourced overseas. Most citizens in inner-cities need basic skills as opposed to higher education. If 40% of college graduates have difficulty finding jobs, how can a high school dropout hope to find work?
From a Jobenomics perspective, basic skills include communication, tradecraft and business. For inner-cities, Jobenomics focuses first on business creation. Small businesses offer the fastest way out of poverty through employment for the unemployed. Every city should have a community-based business generator that mass produces highly-scalable businesses. Our second priority is tradecraft—a skill acquired through experience in a trade—with emphasis on skilled service businesses. The third area is communications. In a business sense, communications entails the ability to express and demonstrate one’s value-proposition.
Jobenomics Community-Based Generators (1) identify and train potential business leaders and business owners, (2) implement highly repeatable and scalable businesses with emphasis on service-providing businesses, (3) establish sources of start-up funding, recurring funding and contracts to provide a consistent source of revenue for new businesses, and (4) provide post start-up business support.
Many metropolitan areas have business incubators that are oriented to emerging high-tech and manufacturing businesses. These incubators are often located in affluent areas or high-tech corridors. Jobenomics offers a complementary concept that focuses on business generators that are oriented towards trade-level, service-providing businesses in economically-depressed areas. Rather than incubating innovative business opportunities one-by-one, a business generator mass produces highly-scalable, start-up businesses. When fully operational, the community-based generator will be capable of creating 1,000 new small businesses per year.
Jobenomics has three fledgling Jobenomics Community-Based Generator projects underway in College Park (Atlanta), Harlem (New York City) and Detroit. Jobenomics is in the process of establishing networks of local non-profit and educational institutions to identify entrepreneurial talent. Once identified, the Community-Based Generator will evaluate candidates via self-employment surveys (see initial self-employment survey at www.Jobenomics.com) and counseling to determine their suitability for business ownership and the type of business.
Following the evaluation phase, candidates will undergo a training, certification and implementation process. Classes will be taught by successful small business owners and entrepreneurs with expertise in startup business implementation. By the end of the program the clients will have:
- An Employer Identification Number (EIN), incorporation (S-Corp, C-Corp or Limited Liability Corporation), and the essentials to run a fully functional company (accounting systems, business plans, legal/regulatory, branding/marketing/sales, financing, etc.).
- A computer supplied with accounting, business planning and website/social networking systems. Training will also be provided including how to obtain appropriate accounting (e.g., bookkeeping and CPA), information technology, and sales/marketing/ advertising/branding support after graduation from the center.
- Supplementary business systems (e.g., website, social networking, bank accounts, etc.) that will facilitate the promotion of the new business.
- Understanding on how to access government grants and investment capital.
- A network of entrepreneurial organizations and on-going business support.
 Jobenomics founded eCyclingUSA™ (www.ecyclingUSA.com) as part of its green-jobs initiative and a way to fund community-based business generators in metropolitan areas. Each month, city managers give away millions of tons of whiteware (e.g., appliances) and other electronic waste (computers and televisions) that contain tens of millions of dollar’s worth of minerals (e.g., copper, aluminum, precious metals) that can be reclaimed, sold on the commodities market or used to develop local industries. eCyclingUSA technology is in operation in 60 plants across Europe. eCyclingUSA plans to implement 50 sites across the US and is committed to donating a minimum of 10% of its annual profits (between $1 and $3 million per year per site) to fund Jobenomics Community-Based Business Generators.
[1] US Census Bureau, Most Children Younger Than Age 1 are Minorities, 17 May 2012, http://www.census.gov/newsroom/releases/archives/population/cb12-90.html
[2] US Census Bureau, 2010 Census Briefs, Overview of Race and Hispanic Origin: 2010, March 2011, Table 1. Population by Hispanic or Latino Origin and by Race for the United States: 2000 and 2010, http://www.census.gov/prod/cen2010/briefs/c2010br-02.pdf
[3] US Department of Labor, Bureau of Labor Statistics, Labor Force Characteristics by Race and Ethnicity 2011, Report 1036, published August 2012 and updated 6 June 2013, http://www.bls.gov/cps/cpsrace2011.pdf
[4] Note: the BLS reports monthly on White, Black and Asian groups but not Hispanics. Consequently, this 2011 report provides the latest official US government “apples-to-apples” comparisons of all four groups.
[5] BLS, Median weekly earnings by race, ethnicity, and occupation, first quarter 2012, http://www.bls.gov/opub/ted/2012/ted_20120419_data.htm
[6] BLS, Household Data Annual Averages, Table 11, Employed persons by detailed occupation, sex, race and Hispanic or Latino ethnicity, Year 2012 (retrieved 12 Sep 2013), http://www.bls.gov/cps/cpsaat11.pdf
[7] US Census Bureau, Income, Poverty, and Health Insurance Coverage in the United States: 2011, by Carmen DeNavas-Walt, Bernadette D. Proctor and Jessica C. Smith, http://www.census.gov/prod/2012pubs/p60-243.pdf, issued September 2012
[8] BLS, Unemployment rate by age, race, and Hispanic or Latino ethnicity, January 2008–February 2013, http://www.bls.gov/opub/ted/2013/ted_20130312.htm
[9] BLS, Table A-2 Employment status of the civilian population by race, sex, and age, September 2013, http://www.bls.gov/news.release/empsit.t02.htm
[10] US Census Bureau, 2007 Survey of Business Owners, http://www.census.gov/econ/sbo/