PDF Version: Income Inequality versus Opportunity 26 November 2012
26 November 2012
There is a significant difference between income inequality and income opportunity. Income inequality represents a rearward view on how much money a person possesses at a given time. Income opportunity represents a forward view of wealth potential and upward social mobility. Jobenomics recognizes income inequality as a starting point, but focuses on income opportunity, via business and job creation, especially at the base of America’s economic pyramid.
Income Inequality. Income inequality is defined as unequal distribution of household or individual income across the various participants (regional, social, racial, gender) in an economy. Income inequality slows economic growth, reduces social mobility, causes financial conflicts and creates discord. A survey for the World Economic Forum identified growing income inequality as one of the world’s most pressing issues for the next decade. After a period of wane, income inequality is growing again in America. US income inequality is often associated with income fairness and is now a dominant issue for policy-makers, media and social activists.
Much of the $6 billion dollars spent on the 2012 US election process focused on income inequality, especially rich (top 1%) versus middle-class and poor (the bottom 99%). Inflammatory rhetoric and political attack ads offered few solutions but exacerbated our political divide. A recent New York Times article[1], entitled Look How Far We’ve Come Apart, addressed the severity of the political divide in our country. Polarization between our two main political parties (shown below) has grown to the point of political paralysis. 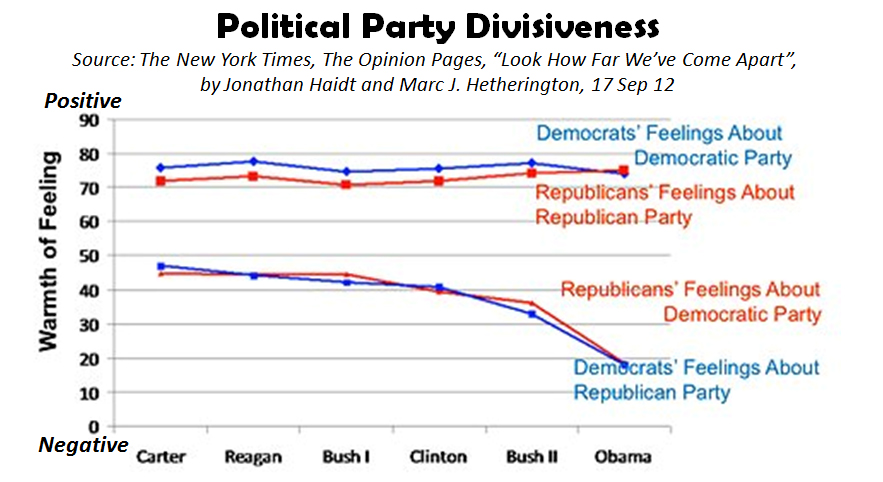
The article also indicates that the US public is similarly divided,
almost to the extent that America was divided prior to the American Civil
War. The media are also polarized. America has reached a crossroads where the left wing no longer believes anything the right as to say, and vice versa. Now that the 2012 elections are history, the world is anxiously watching to see if America can reverse course and unite as a nation to address our strategic challenges. If we continue to focus on income inequality, America will continue to divide politically, socially and economically. The word “inequality” is
divisive, implying inadequacy and disparity. We cannot unify by using words, slogans and data that create dissension.
Conventional wisdom asserts (1) that income inequality is always bad, and (2) the United States is one of the most inequitable distributors of income on the planet. Both of these assertions are not accurate.
Income inequality is not a condition that we should tolerate, but is a myth that it is always bad. Throughout history, income inequality has been a powerful motivator. The American Revolution had issues of income inequality at its roots. Today, many of the greatest American success stories are about people from humble beginnings. Some degree of income inequality can be tolerated as long as a corresponding degree of income opportunity exists. Individuals and businesses would not innovate without the opportunity to reap rewards. When opportunity exceeds inequality, people are generally optimistic and motivated to succeed. However, when inequality exceeds opportunity, people are unhappy and motivated towards discordance. Unfortunately, America has entered a period where inequality exceeds opportunity, which places the US economy at risk.
Regarding the assertion that America is inherently inequitable, let’s take a strategic view of income inequality using official US government data, which is footnoted for the reader. Household income is generally used as the standard measure of income wealth by US government agencies. US household income includes the income of the householder and all other individuals 15 years old and over in the household. Household income is defined as income received on a regular basis not including capital gains or non-cash benefits (food stamps, health benefits, subsidized housing, and most other forms of welfare or entitlement benefits). “Median” household income divides the total number of households and families (including those with no income) into two equal parts.
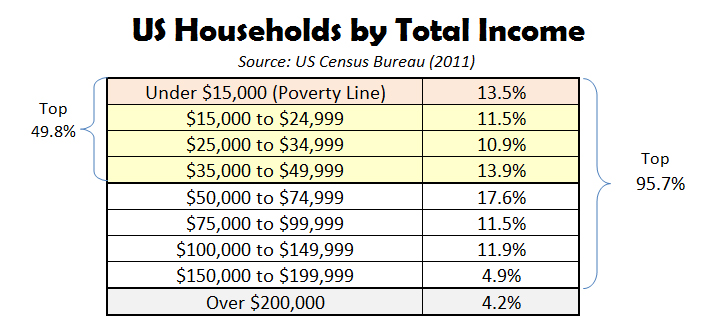
According to the US Census Bureau, 95.7% of US households (multiple incomes) make less than $200,000 and 49.8% make less than $50,000. $50,000 represents the median US household income. The US poverty line is approximately $15,000 depending on the number of people in the household. These groups are usually defined as “middle-class” or “poor”.
The “the rich” are usually defined by personal income categorized in percentiles: top 5%, top 1%, and the ultra-rich. To qualify for an entry level position in the top 5%, a person needs to earn an annual income of $150,000. $340,000 is needed for the top 1%. An ultra-rich person in the top 0.1% starts at $1.5 million. An ultra-rich person in the top 0.01% starts at $8 million.
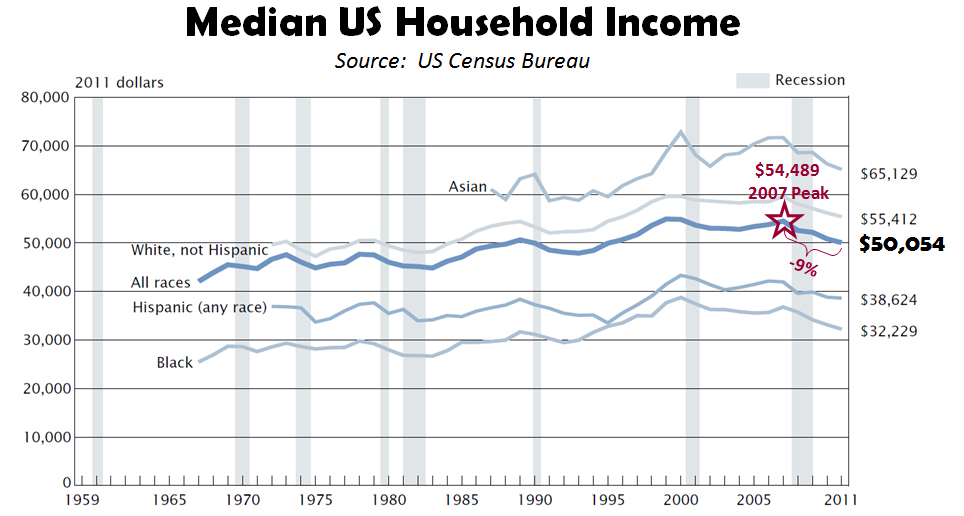
US median household income has fallen substantially this decade—the first such decline since the Great Depression in the 1930s. The Median US Household Income chart, from the 2012 US Census Bureau report[2], shows that median US household income started decreasing prior to the Great Recession. In 2007, the median US household income for all races peaked at $54,489. In 2011, it was $50,054, for a loss of $4,435, or 9%. All races suffered a decline over the same period, but the US Asian community continues to have the highest median household income of $65,129, followed by Whites ($55,412), Hispanics ($38,624) and Blacks ($32,229). Over the decades, income inequality has remained relatively the same between the races, collectively increasing during good times, and collectively decreasing over bad times. During the good times, income inequality was not a politically-charged issue since increasing household income provided a sense of well-being. During the last five years, declining household income has produced anxiety and discord.
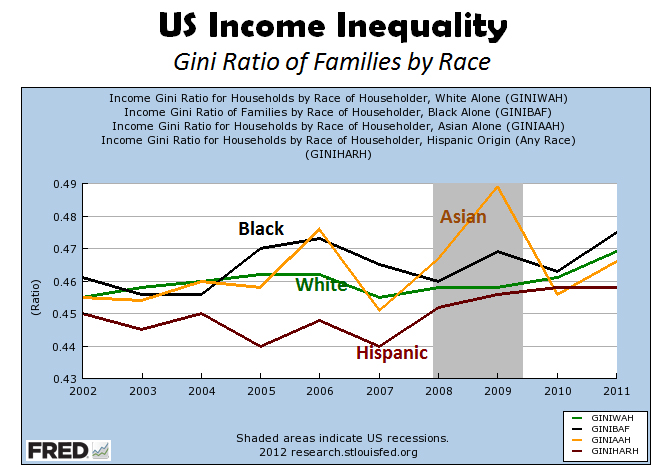
The US Federal Reserve reports[3] on income inequality using the Income Gini Ratio (also called the Gini Index or Gini Coefficient) by race. The Gini Ratio is defined as a measurement of income distribution that ranges from 0, representing perfect equality, to 1, representing prefect inequality. As shown, Black Americans suffer the worse inequality within their own race. In other words, the distance between rich and poor within the Black community is greater than the distance in other races. The Hispanic community is the most homogeneous in terms of household income. Whites and Asians are in the middle with the Asian community having volatile swings during the decade.
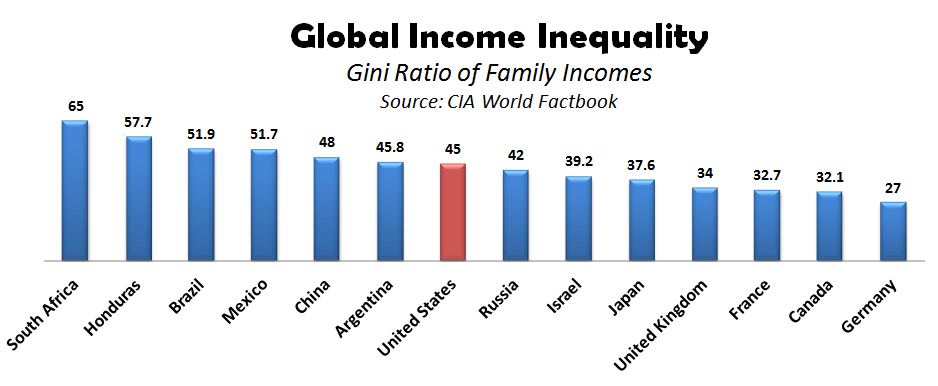
A number of international organizations, like the World Bank and International Monetary Fund, use the Gini Ratio to define income inequality among nations. The Global Income Inequality chart (above) was created by Jobenomics using US Central Intelligence Agency data listed in their widely-accessed World Factbook’s Distribution of Family Income-Gini Index[4], which was compiled by the CIA using data from various international institutions. As far as global income inequality, the United States ranks slightly above average. The world’s worst income inequality is in emerging and totalitarian countries. Industrial and democratic countries are much more equitable in terms of income inequity. Globalization has narrowed the income inequality between nations but has exacerbated income inequality within nations due to global competition, international supply chains, global capital markets, and new information technology.
The data that gets most political and media attention is from the US Census Bureau’s Income Inequality Historical Tables[5]. The Census Bureau reports historical income inequality data in current dollars (not adjusted for inflation) and inflation adjusted dollars.
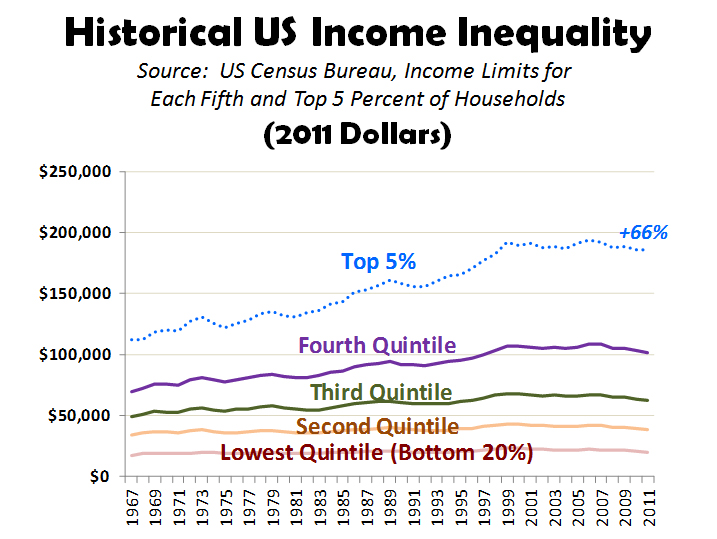
The US Historical Income Inequality chart was created by Jobenomics using Census 2011 dollars (adjusted for inflation) over the last 45 years. Over the last 4 ½ decades, the bottom 95% of US households have not made significant income gains. The top 5% average household income increased from $111,866 in 1967 (note: unadjusted 1967 household income for the top 5% was $19,000) to $186,000 in 2011 for a gain of 66%, or 1.5% per year— significant but certainly not great. To get to great numbers, one must use top 1% or top 0.1% data that is addressed below.
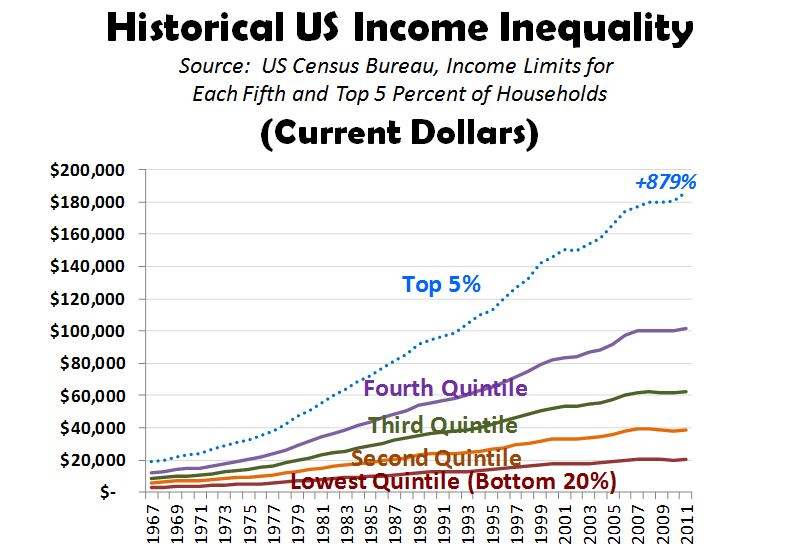
Here is the same chart showing current dollars that are not adjusted for inflation. In current dollars the top 5% increased their average household income by 879% ($19,000 in 1967 to $186,000 in 2011) as opposed 66% ($111,866 in 1967 to $186,000 in 2011) using 2011 Dollars that were adjusted for inflation. Jobenomics believes that inflation adjusted dollars give more of an apples-to-apples comparison, than non-adjusted current dollar comparisons.
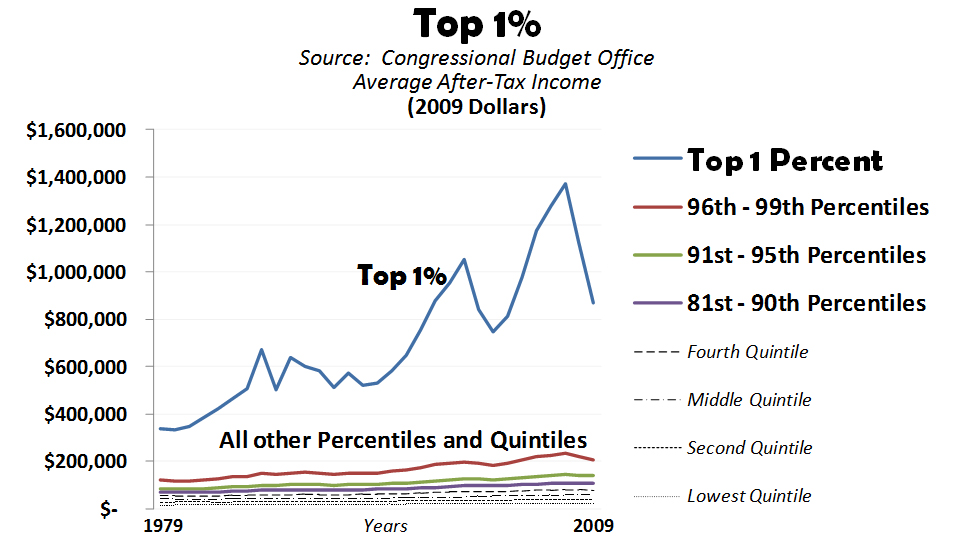
Jobenomics created the Top 1% chart using the most recent bipartisan US Congressional Budget Office report[6], updated August 2012 (note: the US Census Bureau does not report on the top 1%). The chart shows that the top 1% far exceeds all other taxpayer incomes. In 2009 Dollars, the top 1% earned an average after-tax income of $886,700 down from $1,120,500 a year before the recession. The CBO also reports that there are 1.1 million top 1% households out of a total of 117.6 million US households, and that their share of total after-tax income was 11.5%. In other words, the top 1% represents 1% of all households and earns 11.5% of total US income.
There is no US government data that regularly reports on ultra-rich income. However, much antidotal data is available. The average CEO of the top US companies make $13 million per year, not counting stock options. By some accounts, the top 25 hedge fund managers make as much as all the top S&P 500 CEOs. These managers make billions, not millions, per year. From a global perspective, while Americans consider millionaires and billionaires to be rich, there are many areas of the world where personal wealth is measured in billions and trillions. In oil rich Arab nations, baby-sheikhs (20 year olds) are worth tens of billions of dollars and their fathers are trillionaires.
The 2012 presidential campaign debated the merits of increased taxation on the wealthiest American. Using Congressional Budget Office data[7], if taxes were increased by 5% on the top 1%ers, as requested by President Obama, approximately $60,985 more would be paid by each of the 1.1 million 1%ers. The net result would be approximately $69 billion dollars in new tax revenue, which is a relatively insignificant compared to $1 trillion annual deficit spending. Since $69 billion is only 7% of $1 trillion, the other 93% would have to come from increased taxes on the middle-class or reductions in spending. If taxes were increased all Americas in the top 20%, the net result would be $264 billion, or 25% of our annual spending deficit. It should be noted that the lower end top 20%ers (81st to 90th percentile) do not feel that they are wealthy, especially if the average $131,700 household income is a dual income family (e.g., husband and wife) each earning $65,850.
Income Opportunity. Income opportunity involves money that people can earn as opposed to money that they have. The term opportunity implies favorable conditions or prospects in order to attain advancement or success. Today, the American dream of upward mobility, fairness and optimism has been shaken in the wake of a Great Recession, chronically high unemployment and a stagnant economy.
Income opportunity is directly influenced by socio-economic mobility. Socio-economic mobility is the movement of an individual or group from one income level to another. Socio-economic mobility can be upward or downward. In America, with a few exceptions, mass upward socio-economic mobility has been the general trend since the creation of the United States. Most people that enter US workforce from high school or college move from initial lower paying jobs to higher paying careers. Those that dropout of school or society are likely to entrench themselves in the lowest income quintile with much lower mobility. While welfare and unemployment payments provide a safety net for those in the lowest quintile, these payments tend to trap these same individuals in low quintiles by eroding their socio-economic mobility. The longer a person is out of the workforce, the harder it is for that person to get a meaningful job. Socio-economic mobility is also influenced by education and social status. A presentation by Assistant Treasury Secretary Jan Eberly at the 2012 Economic Measurement Seminar produced an insightful graphic on intergenerational socio-economic mobility[8]:
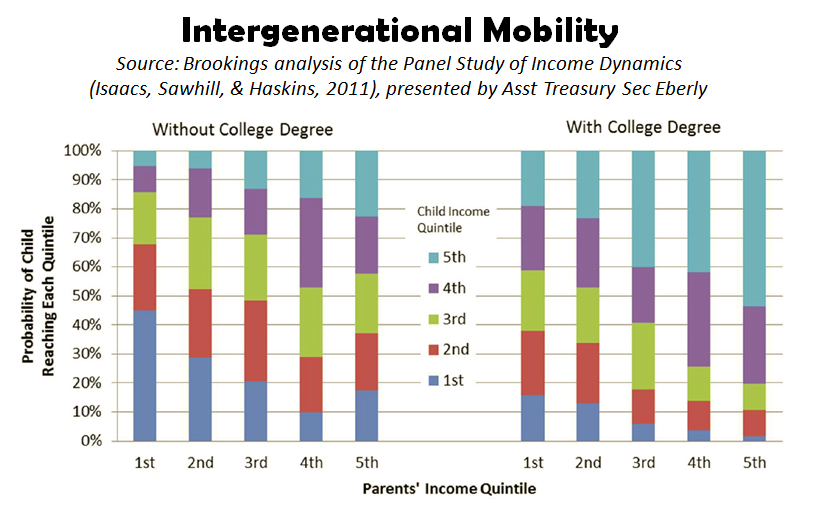 According to Sec. Eberly, higher education is critical for economic mobility. Without a college degree, children born in the bottom income quintile have a 45% chance of remaining there as adults. With a degree, they have a roughly equal chance of attaining each income quintile, which means an 80% chance of being in a higher income quintile than their parents.
While America has always been know as the “land of opportunity”, the Great Recession and chronically high unemployment has eroded socio-economic mobility for those at the base of America’s economic pyramid. A 2012 study[9] by the Economic Mobility Project of the Pew Charitable Trusts states while “Eighty-four percent of Americans have higher family incomes than their parents did….Those born at the top and bottom of the income ladder are likely to stay there as adults. More than 40 percent of Americans raised in the bottom quintile of the family income ladder remain stuck there as adults, and 70 percent remain below the middle”.
Jobenomics believes that high school dropout rates, especially in the inner cities, is symptomatic of a greater problem—the lack of income opportunity. Jobenomics is working with local leaders in Detroit, Harlem, Atlanta, Washington DC and a number of smaller communities, all of whom say that high dropout rates are directly related to the lack of jobs. Why graduate from school when meaningful opportunities are not available? Jobenomics defines meaningful opportunities more in terms of careers as opposed to jobs. To most young people, minimum wage jobs are not meaningful as compared to income opportunities derived from illicit employment or government welfare benefits. Consequently, Jobenomics emphasizes community-based business generators in order to mass produce thousands of micro-businesses in the inner city. Micro-businesses provide meaningful income opportunity.
Many Americans feel that Washington policy-makers can fix our problems. Jobenomics disagrees for a number of reasons. First, a stagnant economy as well as a deeply divided citizenry makes political consensus-building difficult. Second, the biggest challenges for improving income opportunity are beyond Washington’s reach. Thirdly, global competition in the digital age levels the playing field for 6 billion other people around the world who want income opportunity and are often more motivated to strive to get it. While Washington has an important support role, it is up to the private sector to create businesses and jobs.
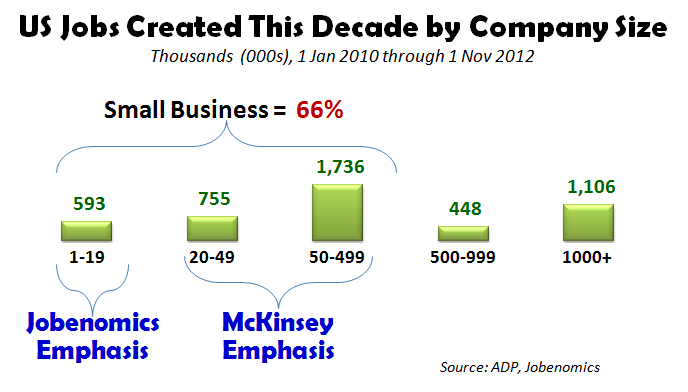
Since the beginning of this decade, small business has created 66% of all new jobs in America.
A recent McKinsey report[10] entitled Restarting the US Small-Business Growth Engine accurately describes small business as the engine of US economic growth with emphasis on “high growth” small businesses. The McKinsey article states that “a subset of small businesses—high-growth ones—creates the vast majority of new jobs. Seventy-six percent of these high-growth firms are less than five years old. The 1 percent of all firms that are growing most quickly (fewer than 60,000 in all) account for 40 percent of economy-wide net new job creation.” The biggest challenge for the McKinsey model is picking winners. It is hard to identify the next generation serial entrepreneurs, like Bill Gates (Microsoft), Steve Case (AOL), Mark Zuckerberg (Facebook) and Meg Whitman (eBay). Therefore, the McKinsey model focuses on small businesses that already have established themselves with potentially high growth products or services. McKinsey also advocates big business and government assistance to help emerging businesses grow rapidly and mass produce jobs.
Jobenomics focuses on “highly scalable” start-up businesses that are unlikely to receive significant government and big business support. Jobenomics is currently working on the establishment of a dozen community-based business generators that will mass produce small and self-employed businesses that can be replicated easily. Self-employed businesses (both incorporated and unincorporated) are a good example of the type of highly scalable business that can be mass produced in order to create millions of jobs. The Jobenomics model focuses on individuals that have a yearning to start a business. Jobenomics is currently concentrating on four demographics: inner city minority groups (service-providing businesses that focus on journeyman skill sets), women-owned businesses (direct-care, direct-sales and education/training businesses), Generation Y (start-up businesses that focus on monetizing social networks and the internet) and veterans-owned businesses (businesses that specialize in defense industry related occupations). These demographics have the potential for 10s of millions of jobs and millions of new businesses that can be replicated across America.
In conclusion, income distribution is relatively well divided in the US even though a majority of Americans believe otherwise. So why are Americans so upset about income inequality when official government data indicates otherwise? For America to prosper, the answer lies with income opportunity, not income inequality.
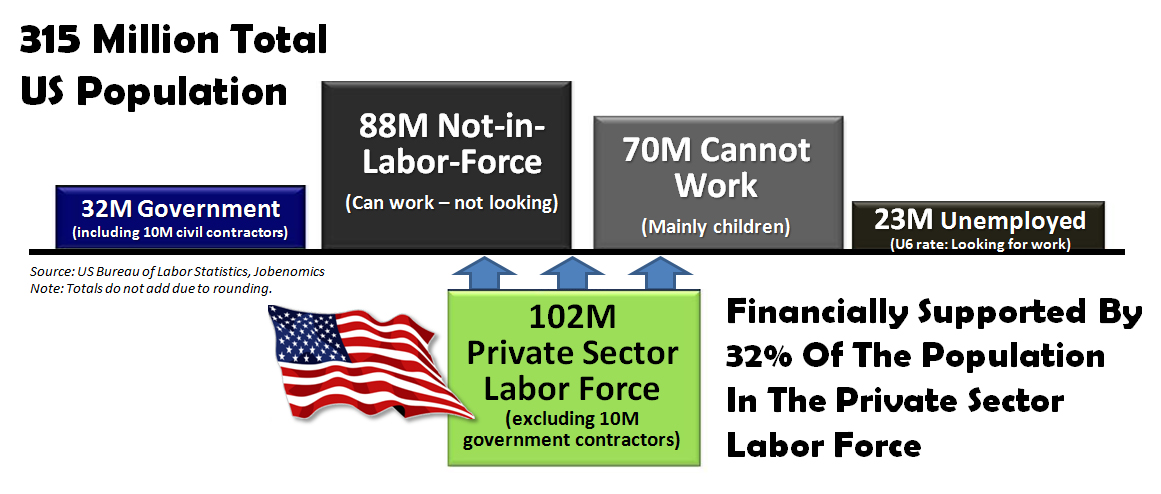
Today, too few are paying for too many. Only 32% of our population financially supports the rest of our population. We have a moral obligation to provide a safety net for the 23 million looking for work and the 70 million that cannot work. We also have an economic imperative to grow the private sector work force that currently consists of 102 million people. The Jobenomics goal is 20 million new private sector jobs by year 2020. The Jobenomics national grassroots plan is designed to unite a divided nation through business and job creation with emphasis on small, emerging and self-employed businesses in the middle and bottom of America’s economic pyramid. Providing meaningful income opportunity is essential to sustaining the American dream of mass upward social mobility.
[1] The New York Times, The Opinion Pages, Look How Far We’ve Come Apart, by Jonathan Haidt and Marc J. Hetherington, http://campaignstops.blogs.nytimes.com/2012/09/17/look-how-far-weve-come-apart/, 17 Sep 12
[2] US Census Bureau, Income, Poverty, and Health Insurance Coverage in the United States: 2011, by Carmen DeNavas-Walt, Bernadette D. Proctor and Jessica C. Smith, http://www.census.gov/prod/2012pubs/p60-243.pdf, issued September 2012
[3] US Federal Reserve Bank of St. Louis, http://research.stlouisfed.org/fred2/graph/?id=GINIBAF,GINIWANHF,GINIHARF
[4] CIA World Factbook, Distribution of Family Income-Gini Index, https://www.cia.gov/library/publications/the-world-factbook/fields/2172.html
[5] US Census Bureau, Historical Income Tables: Income Inequality, H-1 All Races, http://www.census.gov/hhes/www/income/data/historical/inequality/
[6] Congressional Budget Office, Distribution of Household Income (Supplemental data spreadsheet), updated 10 August 2012, http://www.cbo.gov/publication/43373
[7] Ibid
[8] US Department of the Treasury, Remarks of Assistant Secretary Jan Eberly before the National Association of Business Economists (NABE), 2012 ECONOMIC MEASUREMENT SEMINAR, 31 July 2012, http://www.treasury.gov/press-center/press-releases/Pages/tg1662.aspx, and http://www.treasury.gov/press-center/press-releases/Documents/View%20the%20charts%20shared%20with%20NABE%20today.pdf, Page 6
[9] Economic Mobility Project of the Pew Charitable Trusts, Pursuing the American Dream: Economic Mobility Across Generations, 9 July 2012, http://www.pewstates.org/research/reports/pursuing-the-american-dream-85899403228
[10] McKinsey & Company, McKinsey Quarterly, “Restarting the US small-business growth engine”, by John Horn and Darren Pleasance (Strategy Practice), November 2012, http://www.mckinseyquarterly.com/Strategy/Growth/Restarting_the_US_small_business_growth_engine_3032


Pingback/Trackback
Eilen
Pingback/Trackback
ed link
Pingback/Trackback
lunette
Pingback/Trackback
cher
Pingback/Trackback
The Pardu's Scroll
Pingback/Trackback
Income Inequality | My Digital Essay