
Jobenomics Unemployment Report: December 2014
http://Jobenomics.com
By: Chuck Vollmer
7 December 2014
Jobenomics tracks both employment (see: Jobenomics Employment Scoreboard: December 2014) and unemployment (this posting). Download PDF version: Jobenomics Unemployment Report - December 2014 and Jobenomics Employment Report - December 2014
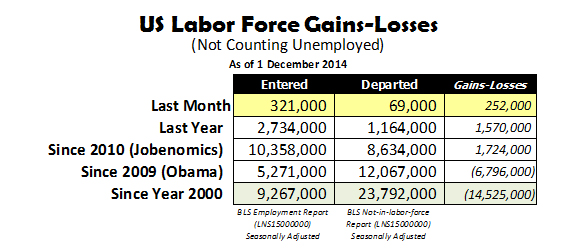
Executive Summary. According to the December 2014 Bureau of Labor Statistics (BLS) Employment Situation Summary[1], the unemployment rate dropped to 5.8%, total nonfarm payroll employment rose by 321,000, and the “Not-in-Labor-Force” category increased by 69,000 citizens who quit looking for work, for a net gain of 252,000 people in the US labor force.
Jobenomics rates the December BLS Employment Situation Summary as a strong report due to two factors. First, 321,000 people entered the US labor force which is well over the threshold number of 250,000 needed for economic growth. Secondly, as shown below, small businesses created 80% of all new jobs last month. Small business is America’s economic engine and employs the vast majority of all Americans. While the number of people voluntarily departing the labor force was a negative 69,000 it was not as large as normal.
The solution to growing the US economy involves business creation with emphasis on small business that has created 73.6% of all new jobs this decade. Small businesses employ 77.4% of all private sector Americans with a total of 91.2 million employees—almost 5 times the amount of large corporations (1000+). Very small businesses with less than 19 employees employ 65% more than all large corporations combined (30.67M versus 18.6M). Contrary to popular opinion, 50% of all small business startups last five years and 30% remain in business over ten years. In addition, small business growth has outperformed medium and large businesses during the recovery from the Great Recession.
While there is reason to celebrate the official unemployment rate dropping to 5.8%, one must understand that it is theoretically possible for the US to have a zero rate of unemployment while simultaneously having zero people employed in the labor force. To be counted in the “unemployed” category, people have to be looking for work. When a person stops looking, the BLS records them in the “not-in-labor-force” category that is reserved for those who can work but are no longer looking. If the total number of unemployed and Not-in-Labor-Force were tallied together as “functionally unemployed”, the US unemployment rate would be a staggering 35%.
Today, out of a total population of 319 million Americans, the US has 110 million working in the private sector, 32 million government workers, 18 million unemployed, 92 million able-bodied people who can work but are not looking, and 69 million (mainly children, retired and disabled) who cannot work. The US economy cannot be sustained by 34% supporting an overhead of 66%. More people must be productively engaged in the private sector labor force for the US economy to flourish.
Understanding Employment and Unemployment Statistics. According to US Department of Labor, the basic concepts involved in identifying the employed and unemployed are quite simple:
- People with jobs are Employed.
- People who are jobless, looking for jobs, and available for work are Unemployed. Those who are marginally employed, and looking for jobs, are deemed Underemployed.
- People who are neither employed nor unemployed are not in the labor force. Those who have no job and are not looking for a job are counted in the BLS’ Not-in-Labor-Force (NiLF) category. When a discouraged worker stops looking for work, that person is no longer considered unemployed by the BLS, they are moved into the NiLF category.
Therefore, as shown:
- Working Population = Employed + Underemployed + Unemployed = 157.8 million.
- Non-Working Population = Not-in-Labor-Force + All Others = 161.6 million.
The Working Population includes 140.0 million employed in government and private sector, and 17.8 million people who have a marginal job, no job, and are looking for work (U6 category). The BLS calls this group, the “Civilian Labor Force”, which is defined as citizens, who have jobs or are seeking a job, are at least 16 years old, are not serving in the military and are not institutionalized.
The Non-Working Population includes 92.4 million in the BLS’ Not-in-Labor-Force category who can work but are not looking. Not-in-Labor-Force includes people (over 16 years old) such as discouraged workers, citizens who choose not to work, welfare recipients, students, retired, stay-at-home caregivers, etc. The remaining All Others category that include 69.2 million children, elderly, disabled, serving in the military, incarcerated, etc.
Unemployment Rate Categories. Every month, the BLS publishes unemployment and employment statistics for economic, policy and public decision-making. Unfortunately, few policy-makers, opinion-leaders, or American citizens truly understand these statistics. More importantly, Americans tend to focus on only one statistic—the U3 rate or “official” unemployment rate—which is deleterious to good decision making. The chart below highlights the U3 rate against a backdrop of other BLS unemployment (can work and are looking) and Not-in-Labor-Force (can work but are not looking) categories.
The BLS calculates six unemployment categories (U1 through U6[2]) every month for those that can work and are looking for work. The three most often reported categories are the so called Long-Term U1 Rate, the Official Unemployment U3 Rate, and the Total Unemployment U6 Rate. These rates and numbers are calculated as a percentage of the US Civilian Labor Force, which is less than half of the total US population of 319 million[3].
As of 1 December 2014, the U1 category is currently 2.7% with 4.2 million unemployed longer than 15 weeks. The U3 category is 5.8% with 9.1 million “officially” unemployed. The U6 category is 11.4% with 17.8 million under-employed or unemployed citizens.
The official unemployment rate (U3 Rate) is a relatively poor indicator of the overall employment situation in the United States. In comparison to those employed and those that can work but don’t (Not-in-Labor-Force), the official unemployment rate is a relatively small number, undeserving of the amount of attention it receives. As shown above, since the beginning of year 2000 to today, the U3 has increased by 3.3 million people compared to employment growth of 12.8 million and Not-in-Labor-Force growth of 23.8 million.
Sooner or later, the American people will figure out that the current way our government calculates unemployment is seriously flawed. Under the current system, it is theoretically possible for the US to have a zero rate of unemployment while simultaneously having zero people employed in the labor force. Stated another way, since Not-in-Labor-Force workers are not counted as unemployed, the official unemployment rate could theoretically be zero if all the current unemployed people simply quit looking for work and joined those in the Not-in-Labor-Force. Americans need to focus on increasing employment and reducing the vast exodus of people leaving our labor force. By shifting focus to business creation, especially small businesses the mainstay of the US economy, the number of the unemployed would decrease correspondingly.
Since the peak of the Great Recession, the official unemployment rate dropped from 10.0% in October 2009 to 5.8% today. Correspondingly, the number of officially unemployed dropped from 15.4 million to 9.1 million, a decrease of 6.3 million people. During the same time period, the number of people who voluntarily dropped out of the work force—many to the netherworld of perpetual unemployment and welfare—increased from 82.8 million to 92.4 million, an increase of 9.6 million. While America reduced its number of it “officially” unemployed, it increased the number of its able-bodied adults without a job by 3.3 million citizens. This demonstrates how, under the current system, it is theoretically possible for the US to have a zero rate of unemployment while simultaneously having zero people employed in the labor force.
The “Functionally Unemployed”. Jobenomics defines “functionally unemployed” as the total number of people that have no job and are capable of working—110.3 million Americans. From a Jobenomics perspective, Not-in-Labor-Force citizens should be classified as long-term unemployed. If all underemployed, unemployed and Not-in-Labor-Force people were “functionally unemployed”; the unemployment rate would be an astounding 35%.
The Jobenomics “functionally unemployed rate” is 35% or 110.3 million people. 110.3 million is calculated by adding the BLS U6 number (17.8 million) and the BLS Not-in-Labor-Force number (92.4 million). Dividing 110.3 million by the total US population of 319.4 million yields a functionally unemployed rate of 35%. Understanding the functionally unemployed rate of 35% is a much better indicator of economic distress, than the much lower 5.8% “official” U3 unemployment rate that is most often watched and reported.
Labor Force Participation. Another way to look at our employment/economic situation is via the Labor Force Participation Rate[4].
The labor force participation rate is the percentage of working-age persons who are employed or unemployed but looking for a job. Since year 2000, the US working population suffered a serious decline from a high of 67.3% to 62.8% today—a net 6.7% decline from peak and rate that was last seen in January 1978—36 years ago. Today’s labor force participation rate would be much lower if not for working women who did not participate in the US labor force in 1978 as they do today.
The primary reason for the dramatic drop in the labor force participation rate is largely due to those that simply have quit looking for work and are now categorized as Not-in-Labor-Force. Alarmingly, the BLS reports that 94% of the people in the Not-in-Labor-Force category currently do not want a job now.
The American workforce is getting grayer. Economic uncertainty is keeping older Americans on the job and delaying retirement. As shown above, the BLS projects that the percentage of older Americans in the US civilian labor force will increase 40% from 1990 to 2020 while the percentage of younger Americans, aged 16 to 24, will shrink by 25%. BLS data also shows that once older workers are out of work, they have a much harder time finding employment than a younger worker.
The BLS’s Employment-Population Ratio[5] is another statistic that is not widely used, but is very useful in a strategic context. This ratio answers the question, “what portion of the working-age population is employed?” and is useful in understanding how our economy is performing. The BLS defines this ratio as the proportion of the civilian noninstitutional population aged 16 years and over that is employed. The civilian noninstitutional population includes all adult workers not in institutions like hospitals, prisons, and military. Today, the total US population is 319 million with a civilian noninstitutional population of 249 million[6] of which 59.2%, or 147 million, are employed. Since the peak on 1 April 2000, 8.5% fewer Americans are engaged in the US work force as a percentage of the total working age population. Unless this trend is reversed, America will increasingly be a nation of haves and have-nots due to an eroding middle-class and a growing welfare population.
The “Not-in-Labor-Force” Category. The downward trends in the US working population and the upward trend in the US non-working population pose serious challenges to America’s economy and way-of-life. These trends are shown in the following charts.
According to BLS data[7], those in the Not-in-Labor-Force category (those that can work but don’t) has surged consistently since year 2000 by 23.8 million people. Since 2009, the start of the Obama Administration, it grew by 12.1 million. Since 2010, the beginning of the decade, it grew by 8.6 million people. In the last 12 months, it grew by 1.2 million. Last month 69 thousand people departed the US labor force and joined the Not-in-Labor-Force category.
In terms of demographics, the Not-in-Labor-Force includes 51 million people 55 years or older (55.3%), 24 million 25-to-54 year olds (25.6%), and 18 million 16-to-24 year olds (19.0%). In terms of gender, Not-in-Labor-Force includes 55 million women (59.6%) and 37 million men (40.4%). Recent trends have been most unfavorable to those over 55 years old, who once out of work tend to stay permanently out of work.
From January 2000 until today, the Not-in-Labor-Force has grown 35% compared to 7% growth in the private sector work force. At the current rate of Not-in-Labor-Force growth, those than can work but choose not to work will outnumber those working sometime in 2022.
Contingency Workers. The US economy is turning to nonstandard workers called contingency workers. Contingency workers (consultants, independent contractors, independent professionals, temporary contract workers, part-time workers, seasonal workers, freelancers, etc.) are replacing full-time employees at an increasing rate. Contingency workers currently represent approximately 31% of the US labor force. According to Bloomberg Businessweek[8], contingency workers could represent 40% of the US labor force by 2020.
In the President’s 2012 budget for the Bureau of Labor Statistics, the Obama Administration proposed collecting data about the contingent work force. Unfortunately, this has not transpired so an accurate accounting is not available. Best estimates put the contingent workforce at 45 million people of which 27 million are part-time works. 7 million part-time workers for economic reasons (involuntary part-time workers who work part-time due to slack work or unfavorable business conditions, inability to find full-time work, or seasonal declines in demand) have increased 114% since year 2000. 20 million part-time workers for noneconomic reasons (voluntary part-time workers who work part-time due to childcare problems, family or personal obligations, school or training, retirement or Social Security limits on earnings, and other reasons) have grown only 4% since year 2000, but is anticipated to increase significantly as more baby boomers deplete their retirement savings. 76 million baby boomers began retiring in 2011. 1/3 of these retirees have no savings and 2/3 will exhaust savings within five years.
The Network Technology Revolution (see http://jobenomicsblog.com/network-technology-revolution/) will enable the information age to upend the industrial age and transform the American labor force as well as the very nature of work. Jobs will increasingly be dissected into discrete tasks, which, in turn, will be addressed by temporary collectives and virtual organizations. Team collaborative and management tools will further create “contextual” work environments that rapidly form, perform, and then reform to address subsequent tasks. More and more brick and mortar edifices will give way to hoteling, mobile computing and significant increases of contingency workers.
Given current trends in productivity, technology and necessity, contingent work could quickly become the dominant form of American labor. Government will try to keep this from happening to keep the onus on big business to produce payroll taxes and provide social benefits. In the end, government will fail to keep the US labor force from rationalizing. During the rationalization process, contingency workers will organize in ways that maximizes earnings and benefits. Jobenomics predicts that small and self-employed businesses will be created to service this need.
In conclusion, business and jobs creation is the number one issue facing US economic recovery. While some would argue that debt/deficits or entitlement/welfare are the biggest issues, it takes businesses to create lasting jobs that generate tax revenue to run government as well as supporting the less fortunate. The following chart is about as simple as Jobenomics can make it.
34% of all Americans are financially supporting the rest of the country. 110 million workers in the private sector are supporting 32M that work for government (including contractors), 92M that can work but choose not to work, 69M that cannot work (children, retired, disabled, etc.) and 18M that are looking for work (officially unemployed and unemployed). For the American economy to prosper in the 21st Century, we must place more emphasis in growing the private sector labor force and reducing the overhead with emphasis on stemming the exodus of people looking for work to not looking for work.
The solution to growing America’s economic base involves engaging our small business economic engine, which is discussed in detail in the Jobenomics Employment Report: December 2014. Even though severely constrained by limited financing and restrictive government policies, small businesses created 73.6% of all new US jobs since the beginning of this decade.
Jobenomics believes that new small, emerging and self-employed businesses could create 20 million new jobs within a decade, if properly incentivized and supported. Today, Jobenomics has a following of several million people. Jobenomics programs involve highly scalable business creation efforts that can mass produce new small US businesses with emphasis on Generation Y-, Women-, Veteran-, and Minority-owned businesses.
[1] US Bureau of Labor Statistics, Employment Situation Summary, http://www.bls.gov/news.release/empsit.nr0.htm
[2] BLS, Table A-15, Alternative measures of labor utilization, http://www.bls.gov/news.release/empsit.t15.htm
[3] US Census Bureau, US & World Population Clocks, http://www.census.gov/main/www/popclock.html
[4] BLS, Labor Force Participation Rate, http://data.bls.gov/timeseries/LNS11300000
[5] BLS, http://data.bls.gov/timeseries/LNS12300000
[6] BLS, Table A-1, Employment Status, http://www.bls.gov/news.release/empsit.t01.htm
[7] BLS, Table A-16, Persons not in the labor force and multiple jobholders by sex, not seasonally adjusted, http://www.bls.gov/webapps/legacy/cpsatab16.htm
[8] Bloomberg Businessweek, 20-25 October 2014 Edition, Companies/Industries, Page20