
Jobenomics tracks both employment (see: Employment Scoreboard: September 2013) and unemployment (this posting).
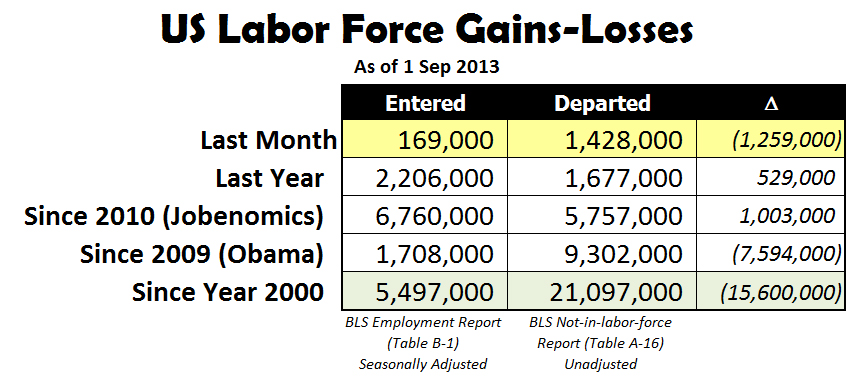
Executive Summary. According the 6 September 2013 US Department of Labor’s Bureau of Labor Statistics (BLS) Employment Situation Summary[1], total nonfarm payroll employment increased by 169,000 in August 2013, and the unemployment rate edged down to 7.3%. While these figures indicate a modest gain, the overall employment/unemployment situation deteriorated significantly with 1,428,000 voluntarily leaving the US labor force according to Bureau of Labor Statistics in a category called “Not in the Labor Force”[2] that includes people that can work but chose not to work. In addition, the change in total nonfarm payroll employment for June 2013 was revised from +188,000 to +172,000, and the change for July 2013 was revised from +162,000 to +104,000, which equates to a reduction of 74,000 in the previous two months. Within the last year, the US has achieved a net gain of 529,000 jobs between those entering and leaving the labor force. Since the beginning of the decade (January 2010), the US had a net gain of 1,003,000 jobs. Since the beginning of the Obama Administration (January 2009), the US had a net loss of 7,594,000 that mainly occurred during the last year of the Great Recession. Since year 2000, almost 4 times as many people departed the US labor force than entered it, with 5,497,000 people entering the US labor force as opposed to 21,097,000 who departed.
Understanding Employment and Unemployment Statistics. According to Bureau of Labor Statistics, the basic concepts involved in identifying the employed and unemployed are quite simple:
- People with jobs are Employed.
- People who are jobless, looking for jobs, and available for work are Unemployed. Those who are marginally employed, and looking for jobs, are deemed Underemployed.
- People who are neither employed nor unemployed are not in the labor force. Those who have no job and are not looking for one are counted in the BLS’ Not-in-Labor-Force (NiLF) category. When a discouraged worker stops looking for work, that person is no longer considered unemployed by the BLS, they moved into the NiLF category.
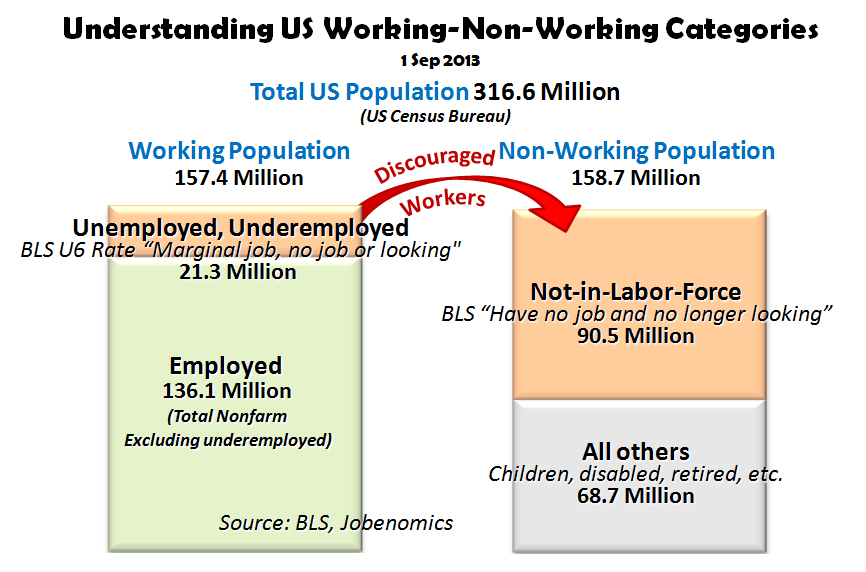
Therefore, as shown above:
- Working Population = Employed + Underemployed + Unemployed = 157.4 million.
- Non-Working Population = Not-in-Labor-Force + All Others = 158.7 million.
The Working Population includes 136.1 million employed and 21.3 million people who have a marginal job, no job, or are looking for work (U6 category). The BLS calls this group, the “Civilian Labor Force”, which is defined as citizens, who have jobs or are seeking a job, are at least 16 years old, are not serving in the military and are not institutionalized.
The Non-Working Population includes 90.5 million in the BLS’ Not-in-Labor-Force category who can work but are not looking. Not-in-Labor-Force includes people (over 16 years old) such as discouraged workers, citizens who choose not to work, welfare recipients, students, retired, stay-at-home caregivers, etc. The remaining All Others category that include 68.7 million children, elderly, disabled, serving in the military, incarcerated, etc.
Unemployment Rate Categories. Every month, the BLS publishes unemployment and employment statistics for economic, policy and public decision-making. Unfortunately, few policy-makers, opinion-leaders, or American citizens truly understand these statistics. More importantly, Americans tend to focus on only one statistic—the U3 rate or “official” unemployment rate—which is deleterious to good decision making. The chart below highlights the U3 rate against a backdrop of other BLS unemployment (can work and are looking) and not-in-labor-force (can work but are not looking) categories.
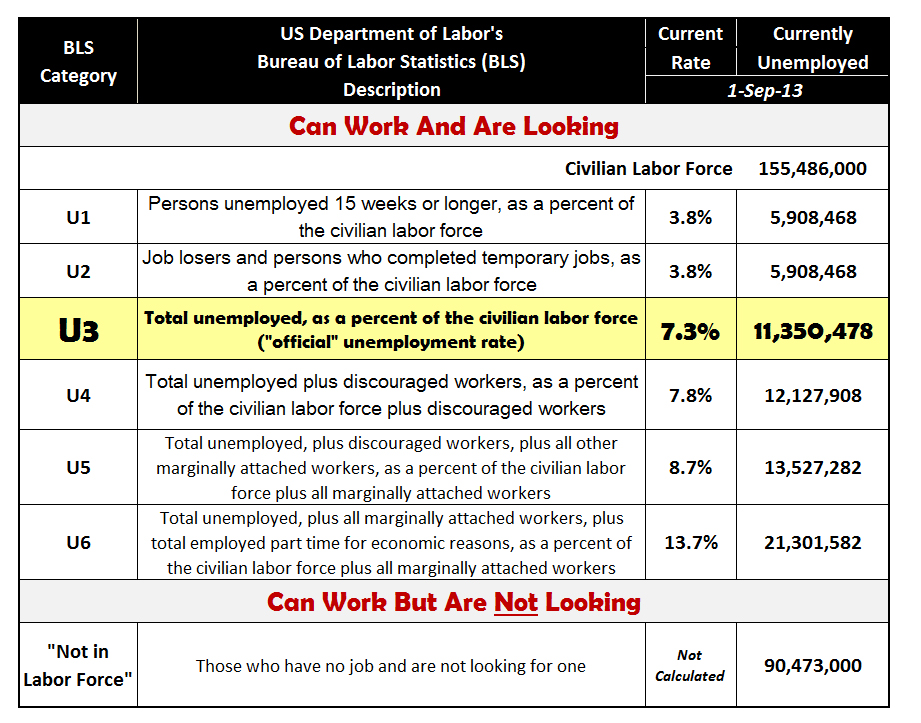
The BLS calculates six unemployment categories (U1 through U6[3]) every month for those that can work and are looking for work. The three most often reported categories are the so called Long-Term U1 Rate, the Official Unemployment U3 Rate, and the Total Unemployment U6 Rate. These rates and numbers are calculated as a percentage of the US Civilian Labor Force, which is about half of the total US population of 316.6 million[4].
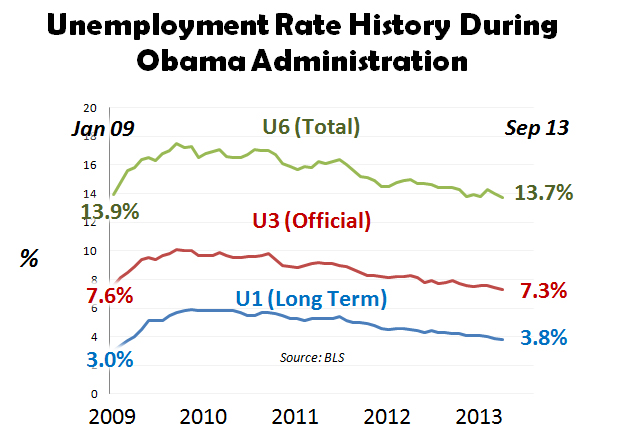
As of 1 September 2013, the U1 category is currently 3.7% with 5.9 million unemployed longer than 15 weeks. The U3 category is 7.3% with 11.4 million “officially” unemployed. The U6 category is 13.7% with 21.3 million under-employed or unemployed citizens.
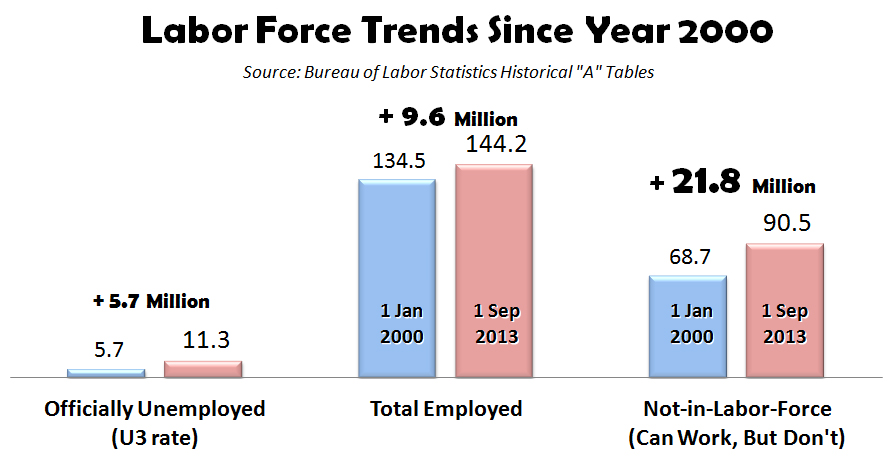
The official unemployment rate (U3 Rate) is a relatively poor indicator of the overall employment situation in the United States. In comparison to those employed and those that can work but don’t (Not-in-Labor-Force), the official unemployment rate, called the U3 rate, is a relatively small number, undeserving of the amount of attention it receives. Since the beginning of year 2000 to today, the U3 has increased by 5.7 million people compared to employment growth of 9.6 million and Not-in-Labor-Force growth of 21.8 million.
Sooner or later, the American people will figure out that the current way our government calculates unemployment is seriously flawed. Under the current system, it is theoretically possible for the US to have a zero rate of unemployment while simultaneously having zero people employed in the labor force. Stated another way, since Not-in-Labor-Force workers are not counted as unemployed, the official unemployment rate could theoretically be zero if all the current unemployed people simply quit looking for work and joined those in the Not-in-Labor-Force.
Jobenomics contends that Americans need to focus on increasing employment with emphasis on small businesses that currently employ 77% of the US work force, and reducing the vast exodus of people leaving our labor force—many to a netherworld of perpetual unemployment. By shifting our focus to employment (entry and exodus), the number of the unemployed would decrease correspondingly.
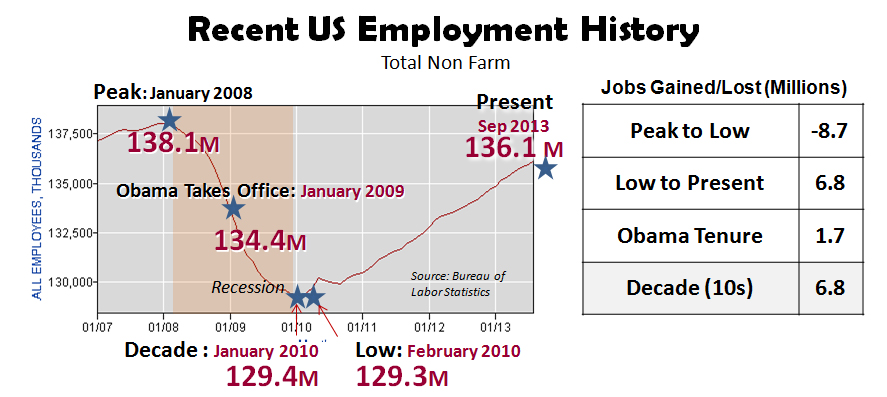
The chart above shows the recent US employment history[5]. US peak employment occurred in January 2008 with 138.1 million employed. The post-Great Recession low occurred in February 2010 with 129.3 million employed. Today, there are 135.1 million employed. Consequently, 8.7 million jobs were lost from peak to low. From the low to present, 6.8 million jobs were created. From the start of the Obama Administration, the US has produced 1.7 million jobs. From the start of this decade, the Jobenomics starting point, 6.8 million jobs were created—all in the private sector, whereas each level of government (federal, state and local) lost jobs.
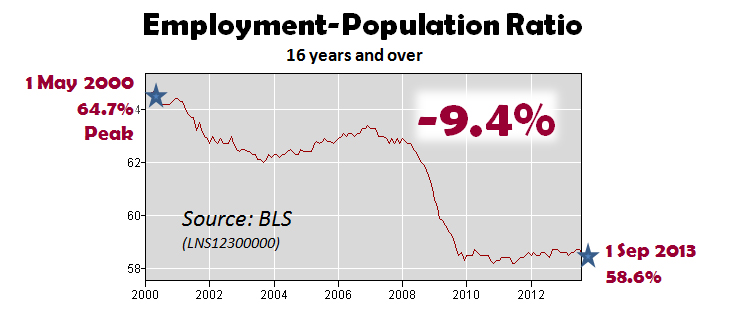
The BLS’s Employment-Population Ratio[6] is another statistic that is not widely used, but is very useful in a strategic context. This ratio answers the question, “what portion of the working-age population is employed?” and is useful in understanding how our economy is performing. Since the beginning of this decade, 9.4% fewer Americans are engaged in the US work force. More importantly, since the end of the Great Recession, the percentage of employed Americans has not increased relative to population growth. Unless this trend is reversed, America will increasingly become a nation of haves and have-nots due to an eroding middle-class.
The “Not-in-Labor-Force” Category. The downward trends in the US working population and the upward trend in the US non-working population pose serious challenges to America’s economy and way-of-life. These trends are shown in the following charts.
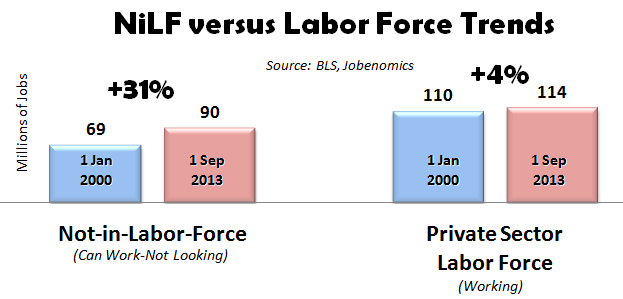
From January 2000 until today, the Not-in-Labor-Force has grown 31% compared to 4% growth in the private sector work force. At the current rate of Not-in-Labor-Force growth, those than can work but choose not to work will outnumber those working sometime in 2021/22.
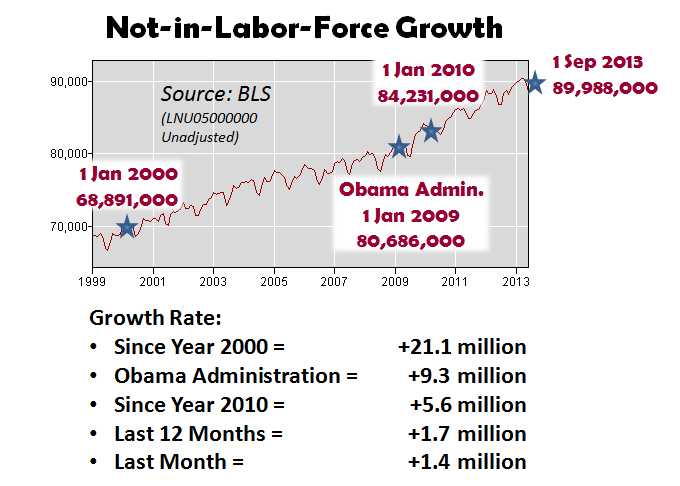
According to BLS data[7], those in the Not-in-Labor-Force category (those that can work but don’t) has surged consistently since year 2000 by 21.1 million people. Since 2009, the start of the Obama Administration, it grew by 9.3 million. Since 2010, the beginning of the decade, it grew by 5.6 million people—more than the number of all new jobs created. In the last 12 months, it grew by 1.7 million. Last month, 1.4 million left the work force.
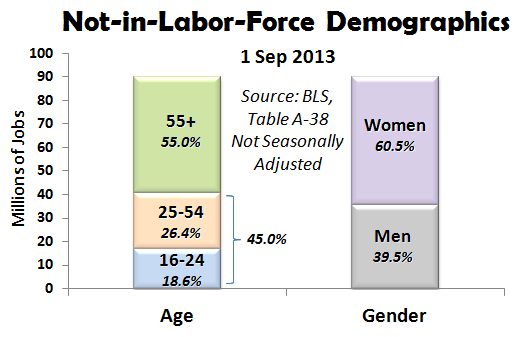
Today 90 million[8] people are classified as “not in the labor force” by the BLS. As shown above, in terms of age, the Not-in-Labor-Force includes 49.5 million people 55 years or older (55.0%), 23.7 million 25 to 54 year olds (26.4%), and 16.7 million 16 to 24 year olds (18.6%). In terms of gender, NiLF includes 54.4 million women (60.5%) and 35.6 million men (39.5%). Recent trends have been most unfavorable to those over 55 years old, who once out of work tend to stay permanently out of work.

Labor Force Participation. Another way to look at our employment/economic situation is via the Labor Force Participation Rate[10]. The labor force participation rate is the percentage of working-age persons who are employed or unemployed but looking for a job. Since year 2000, the US working population suffered a serious decline from a high of 67.1% to 63.2% today—a rate that was last seen in August 1978. The primary reason for the dramatic US drop is largely due to those that simply have quit looking for work and are now categorized as Not-in-Labor-Force. Alarmingly, the BLS reports that 93% of the people in the Not-in-Labor-Force category currently do not want a job now.
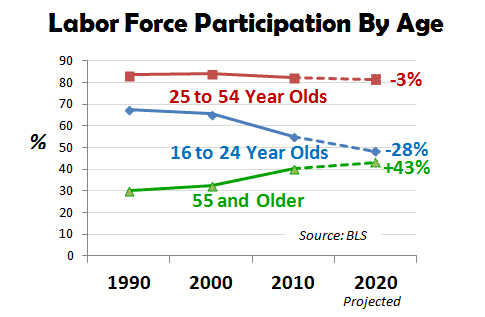
The American workforce is getting grayer. Economic uncertainty is keeping older Americans on the job and delaying retirement. According to The Conference Board (independent business membership and research association), “nearly two-thirds of Americans between the ages of 45 and 60 say they plan to delay retirement… The increase was driven by the financial losses, layoffs and income stagnation sustained during the last few years of recession and recovery.”[9] As shown above, the BLS projects that the percentage of older Americans in the US civilian labor force will increase 43% from 1990 to 2020 while the percentage of younger Americans will shrink by 28%. Labor Department data also shows that once older workers are out of work, they have a much harder time finding employment than a younger worker.
The “Functionally Unemployed”. When a discouraged worker quits looking for work, he/she is eventually moved into the Not-in-labor-force category—which essentially means that this former worker is in an unemployment limbo and off-the-grid from a working population perspective.
Jobenomics defines “functionally” employed as the total number of people that have no job and are capable of working—111.8 million Americans. From a Jobenomics perspective, Not-in-Labor-Force citizens should be classified as long-term unemployed. If all underemployed, unemployed and Not-in-Labor-Force people were “functionally unemployed”, the unemployment rate would be an incredible 35%.
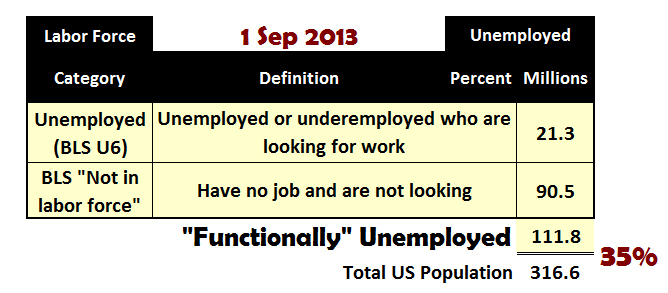
The Jobenomics “functionally unemployed rate” equates to 35% of the US population or 111.8 million people. 111.8 million is calculated by adding the BLS’ U6 number (21.3 million) and the BLS’ Not-in-Labor-Force number (90.5 million, the BLS’s seasonally adjusted number). Dividing 111.8 million by the total US population of 316.6 million yields a functionally unemployed rate of 35%.
Understanding the functionally unemployed rate of 35% is a much better indicator of economic distress, than the much lower 7.3% “official” U3 unemployment rate that is most often watched and reported. Jobenomics asserts that overemphasis on the official unemployment rate is economically dangerous.
In conclusion, business and jobs creation is the number one issue facing US economic recovery. While some would argue that debt/deficits or entitlement/welfare are the biggest issues, it takes businesses to create lasting jobs that generate tax revenue to run government as well as supporting the less fortunate. The following chart is about as simple as Jobenomics can make it.
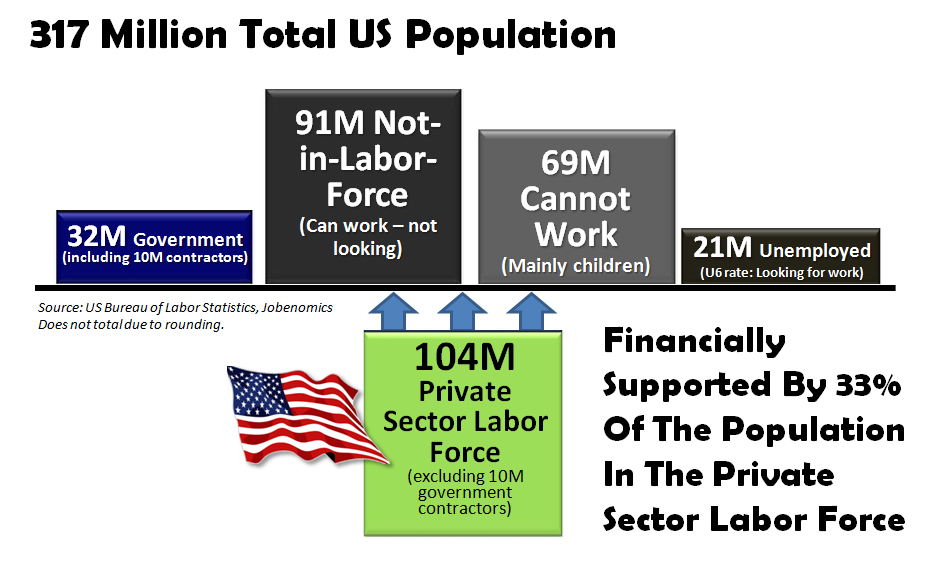
33% of all Americans are financially supporting the rest of the country. 104 million workers in the private sector are supporting 32M that work for government (including contractors), 91M that can work but choose not to work, 69M that cannot work (children, retired, disabled, etc.) and 21M that are looking for work (officially unemployed and unemployed). For the American economy to prosper in the 21st Century, we must place more emphasis in growing the private sector labor force and reducing the overhead with emphasis on stemming the exodus of people looking for work to not looking for work.
[1] US Bureau of Labor Statistics’ Employment Situation Summary, http://www.bls.gov/news.release/empsit.nr0.htm
[2] BLS, Table A-16. Persons not in the labor force, http://www.bls.gov/webapps/legacy/cpsatab16.htm
[3] BLS, Table A-15. Alternative measures of labor utilization, http://www.bls.gov/news.release/empsit.t15.htm
[4] US Census Bureau, US & World Population Clocks, 7 Sep 12, http://www.census.gov/main/www/popclock.html
[5] BLS, Table B-1, Total Nonfarm, Seasonally Adjusted, http://data.bls.gov/timeseries/LNS12300000,
[6] BLS, http://data.bls.gov/timeseries/LNS12300000
[7] BLS, Table A-16, Persons not in the labor force and multiple jobholders by sex, not seasonally adjusted, http://www.bls.gov/webapps/legacy/cpsatab16.htm
[8] BLS, Table A-38, Persons not in the labor force by desire and availability for work, age, and sex, http://www.bls.gov/web/empsit/cpseea38.htm
[9] The Conference Board, Gad Levanon on surging number of Americans delaying retirement, http://www.conference-board.org/, 1 Feb 2012
[10] BLS, http://data.bls.gov/timeseries/LNS11300000